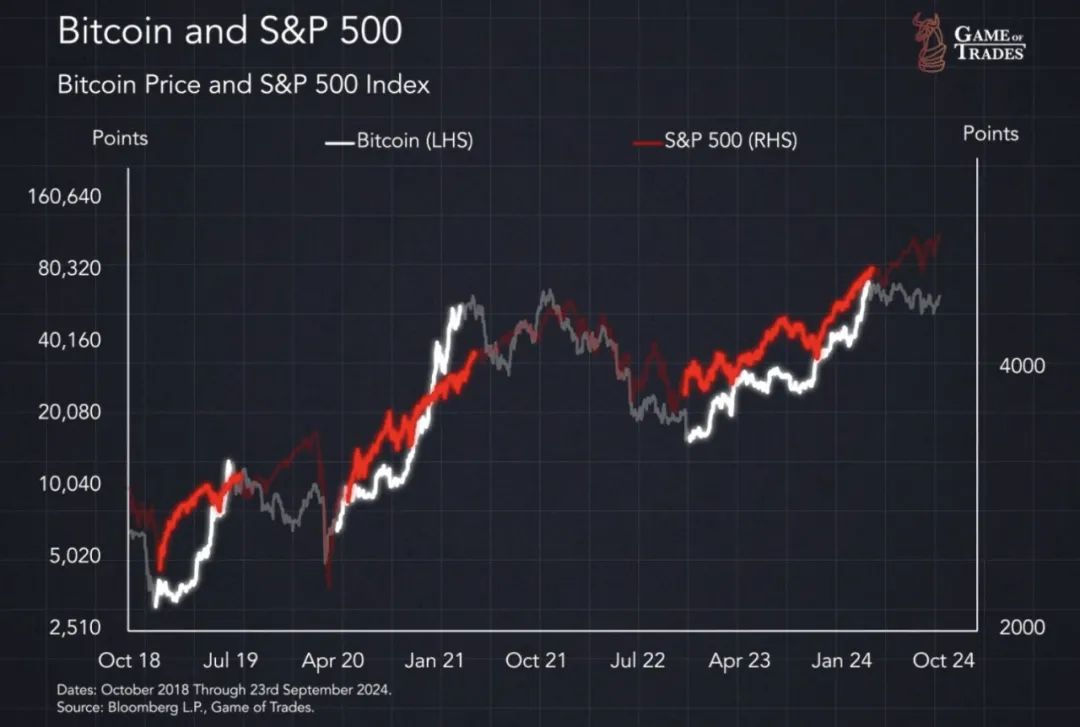
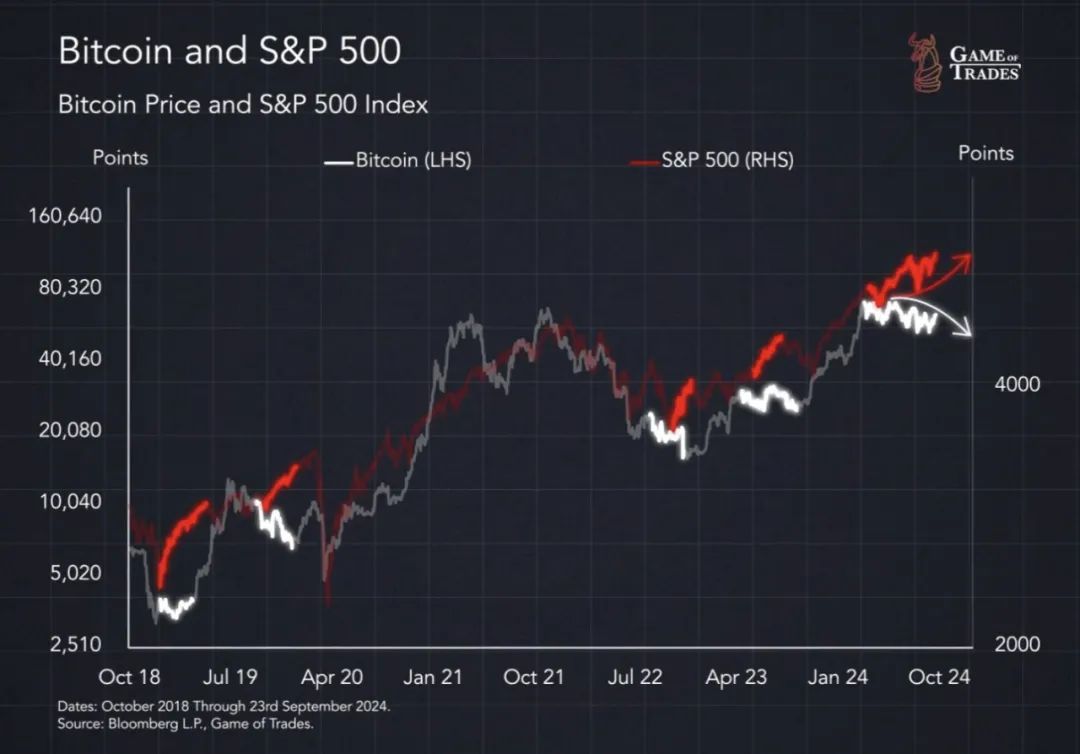
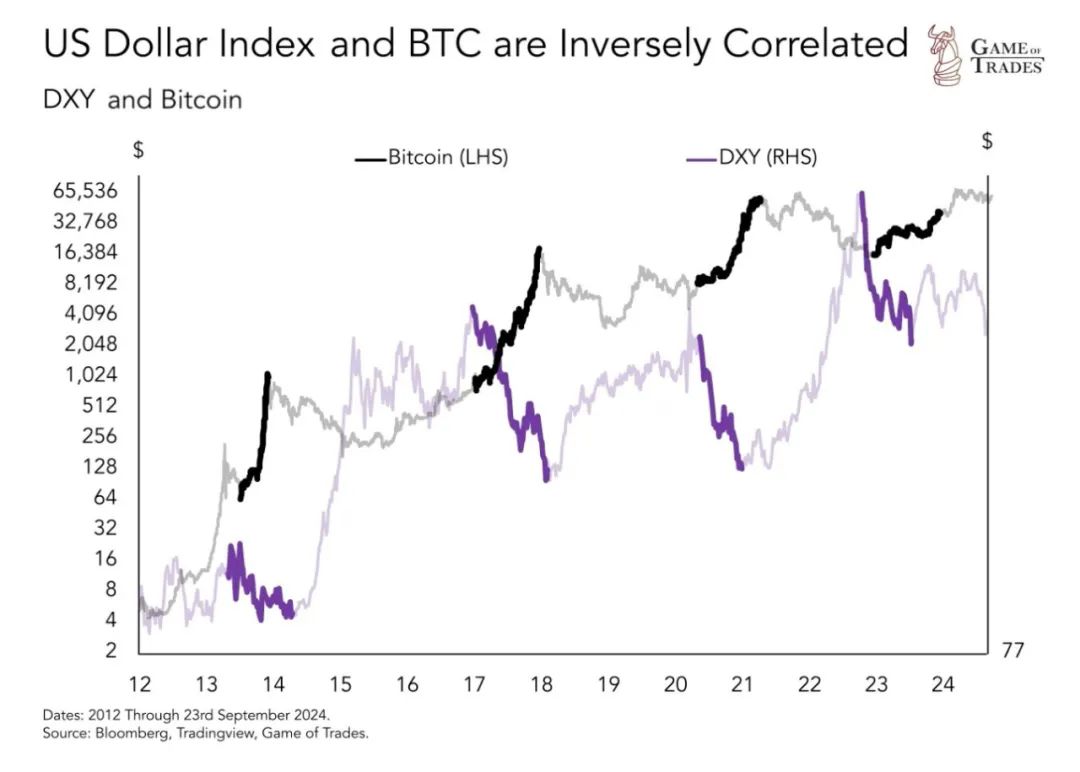
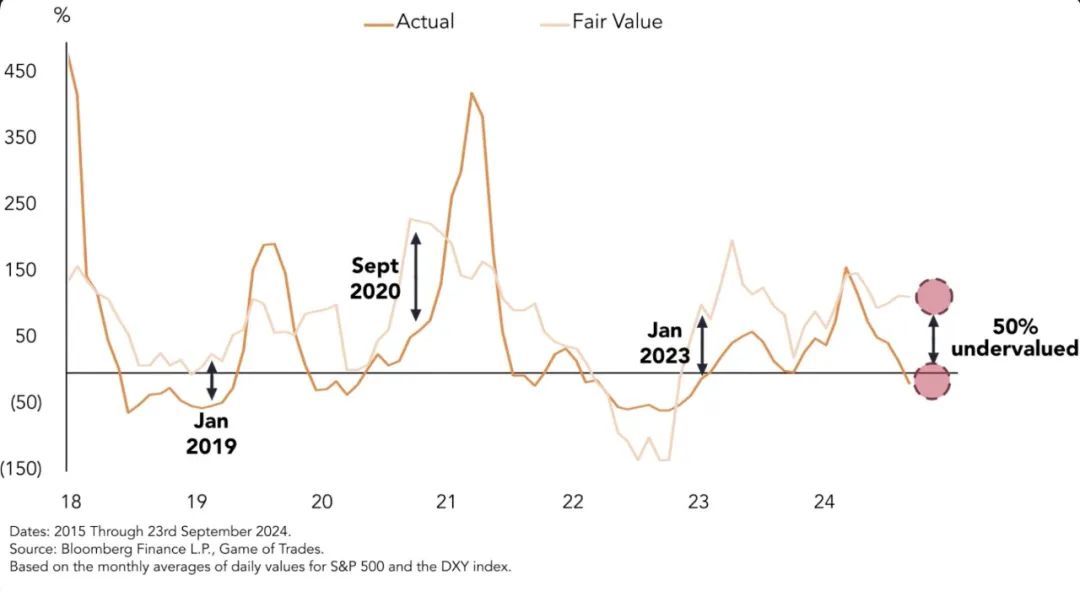
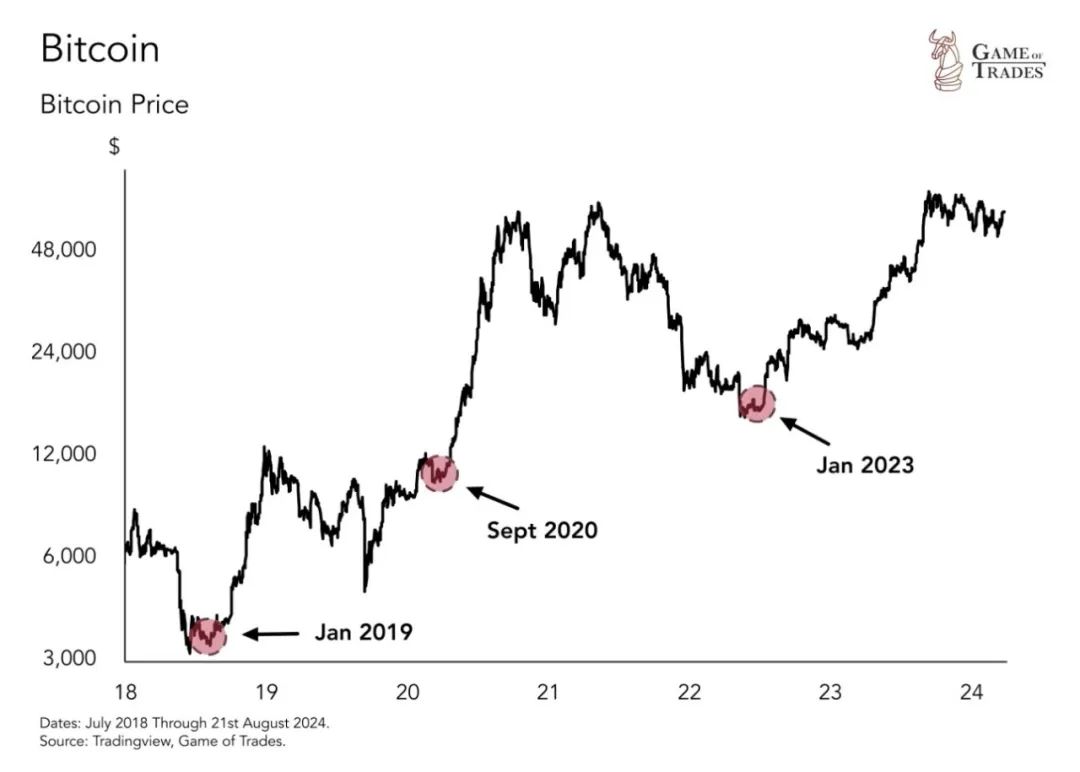
Overnight, BTC continued to hold steady at 65k, pointing to 66k. After the Federal Reserve cut interest rates recently, the mood for gold, US stocks, and A-shares is rising one after another; on the contrary, BTC appears to be lagging behind. Someone (Game of Trades) studied the divergence between BTC and the S&P 500 and the negative correlation between the BTC and US dollar indices over the past six months and came to a conclusion: the current market price of BTC is underestimated by 50%, and the actual price may exceed $120,000 to $140,000.
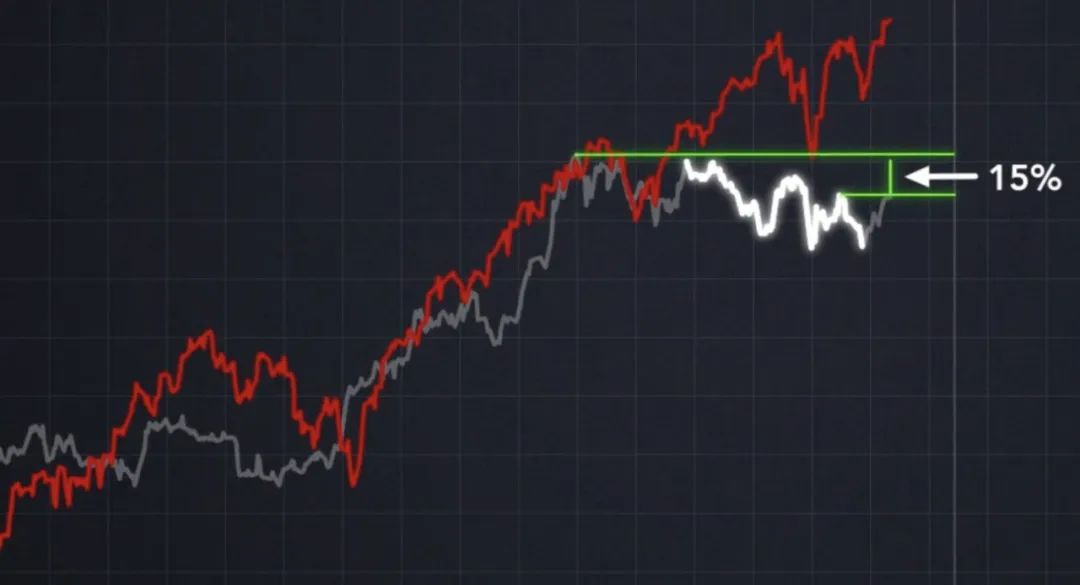
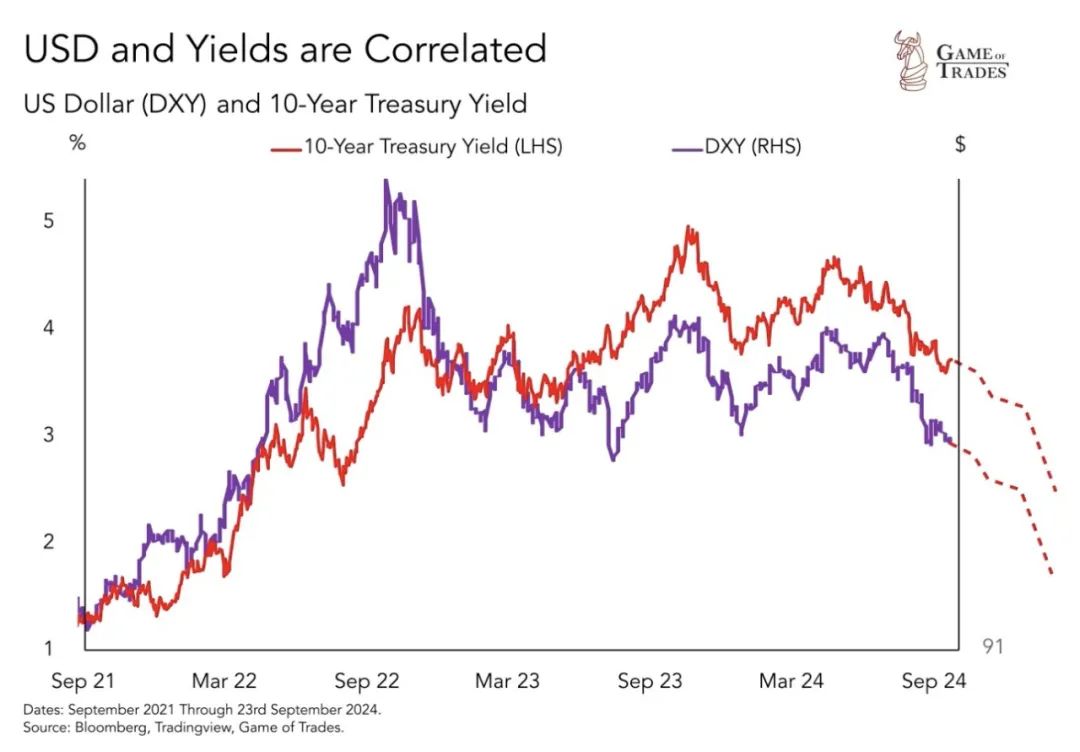
Generally speaking, the upward phase of BTC will resonate with the same frequency as US stocks. As shown in the picture below, the bottom recovered from the end of 2018 to mid-2019, the early fast bulls from April 2020 to the beginning of 2021, breaking out of the bear market from the end of 2022 to the beginning of 2024, etc. However, at some point, we will also see a divergence in the trend of BTC and US stocks. As shown in the picture below, the bottom of the BTC bear market fluctuated sideways at the end of 2018, BTC fluctuated and the S&P 500 rose in the second half of 2019, the BTC bear market bottomed out in the second half of 2022, and the S&P 500 rose in early 2023. The most recent long-term divergence was that since March 2024, the BTC market fluctuated sideways and the S&P 500 rose. As a result, many people have the illusion that if BTC rises, US stocks will definitely rise; if US stocks rise, BTC will not necessarily rise; but if US stocks fall, BTC will definitely fall. Seen this way, the right time for US stocks to rise should be more than BTC. However, the end result was that BTC's increase far outperformed US stocks. It's like dad running with his son. When my son starts running, dad sometimes speeds up together, and sometimes walks slowly and leisurely. When my son can't run, dad also stops and waits for him. But as soon as dad speeds up, he can always easily surpass his son. Don't just see your son running far longer than his dad; in fact, dad always takes less time to run faster and farther than his son. BTC is the father, and the US stock market is the son. Well, this time from March of this year to September now, my son is still running, but my dad has stopped and walked slowly and leisurely; this is just waiting. The six-month turbulence arrangement is meant for those who chased up the market in March to have a sufficient time window to increase their positions and establish positions every time they fall. The average cost of opening a position is around $60,000. This is the starting point benchmark for the next phase of the market. BTC is a sensitive indicator of the weakening of the US dollar. It has a negative correlation with the US dollar index DXY. As shown in the figure below, DXY fell and BTC skyrocketed in 2013, DXY fell and BTC soared in 2017, DXY fell and BTC soared in 2020, DXY fell in 2023, and BTC recovered rapidly. why? Because of the so-called rise and fall of BTC, it is a nominal price denominated in US dollars. When the dollar weakens, the nominal price does not change, which is equivalent to an actual discount. This will induce non-US buyers to rush to buy, and demand will skyrocket. This is due precisely to the unique advantages of BTC as a world currency and global asset. Now, the Federal Reserve is officially starting to cut interest rates. This means that next, the US dollar will start a new round of decline along with US bond yields. And this is expected to drive a new round of BTC's surge. According to researchers' estimates, the current market price of BTC is undervalued by about 50%. In past history, when there was such a drastic underestimation, there were also January 2019, September 2020, January 2023, etc. However, when there was such a drastic undervaluation three times in the past, it was the night before the BTC explosion without exception. Sit back, fasten your seatbelt, and don't get thrown out of the car. The fun and exciting adventure is about to begin!