


After testing 159 tokens, it was discovered that with the exception of Hyperliquid, repurchases and destruction are mostly just stories

Author: Connor King
Compiled by Deep Wave TechFlow
Original title: 159 Token Test: With the exception of Hyperliquid, most tokens destroyed by buyback are losing money
Guide: This article tested 6 token value accumulation mechanisms for 159 agreements and found that revenue scale is more important than mechanism design — the average return of agreements with daily revenue exceeding 500,000 US dollars is +8%, and the lowest level is -81%. More importantly, many mechanisms that seem to be “winning” are reversed immediately after removing one or two leading projects, which has direct reference value for investors in choosing tokens.
We mapped 6 value accumulation mechanisms for 159 tokens and tested which mechanisms actually translate into rewards for token holders.
The crypto industry's narratives about the accumulation of token value are mostly wrong.
Research settings
Two weeks ago, we released our 2026 Investor Relations and Token Transparency report. One of the findings: 38% of crypto protocols actively accumulate value, and 62% don't return any value to token holders.
This article is a companion analysis. We took a data set of 159 protocols, classified each coin according to an accumulation mechanism, and pulled 1-year price performance from Artemis. The question is: What mechanisms actually translate into rewards?
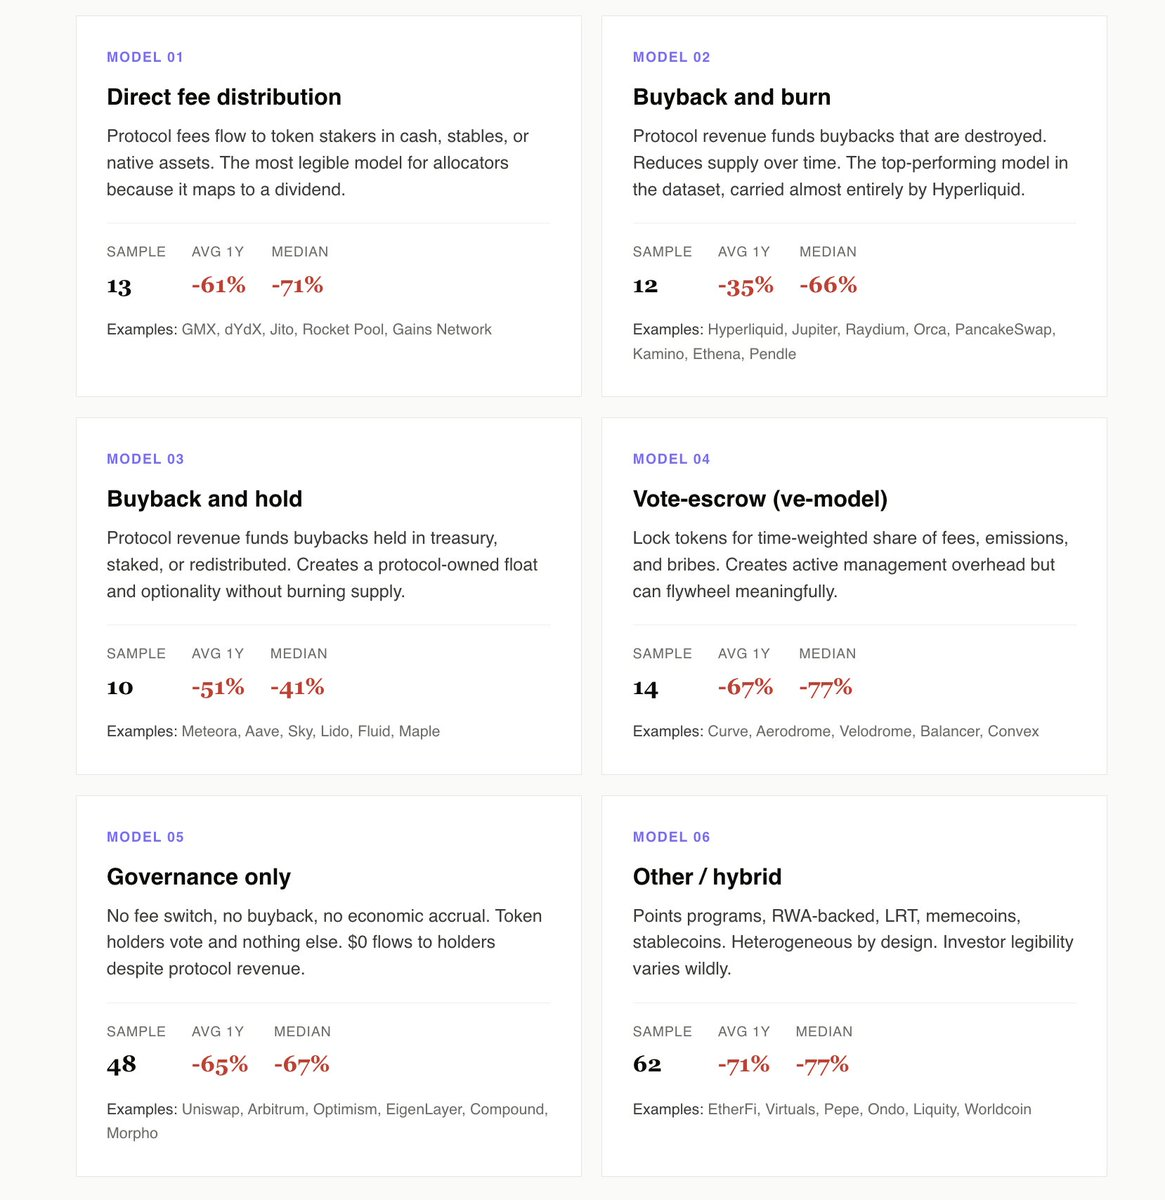
We identified 6 models: direct cost allocation, buyback and destruction, buyback holding, vote hosting (ve model), pure governance, and other/hybrid models.
Here's what we found:
Active accumulation is 10 percentage points ahead of pure governance
The 49 agreements of direct fees, buyback and destruction, repurchase holding, and ve models have averaged a return of -55% over the past year. The 48 pure governance agreements averaged -65%.
The gap widens further when limited to pure governance tokens that generate revenue, such as Uniswap, Arbitrum, and Morpho. These agreements generate real revenue, but not a single penny is distributed to token holders. Opportunity costs are the most visible part of the data set.
Pure governance is equivalent to an investor relations strategy where a listed company neither pays dividends nor buys back shares. The final installers stopped pretending that it was a continuing operation and began pricing it as an option that management realized.
Hyperliquid is a buyback destruction category
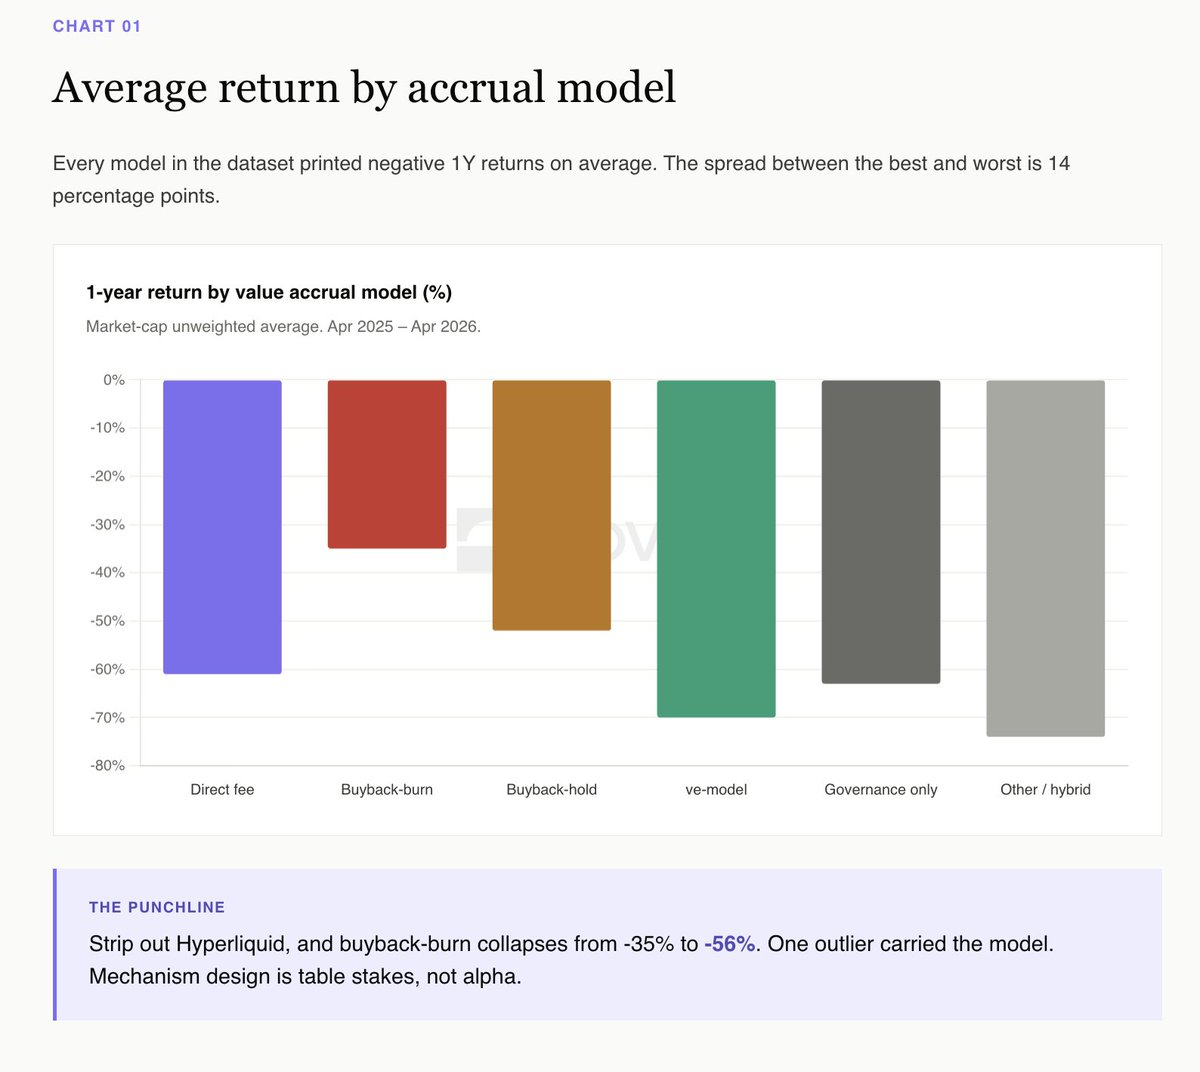
Judging from superficial data, buyback destruction won this year (average -35%), and buyback holding ranked second (-52%). This looks like a complete victory for destruction.
But after removing Hyperliquid, the story reverses. Excluding HYPE, repurchases destroyed an average of -56%, and repurchase held averaged -52%. A single token determines an entire category.
Meteora is the cleanest buyback holding case. $10 million buyback program, Novora investor relations score 95/100, transparent treasury accumulation. This year, it fell by about 40%, below the similar median. Tokens held for repurchase in a transparent treasury retain the right to choose, creating visible and audited circulation. Destruction destroyed the right to choose in exchange for a marketing headline.
The scale of revenue is the real signal
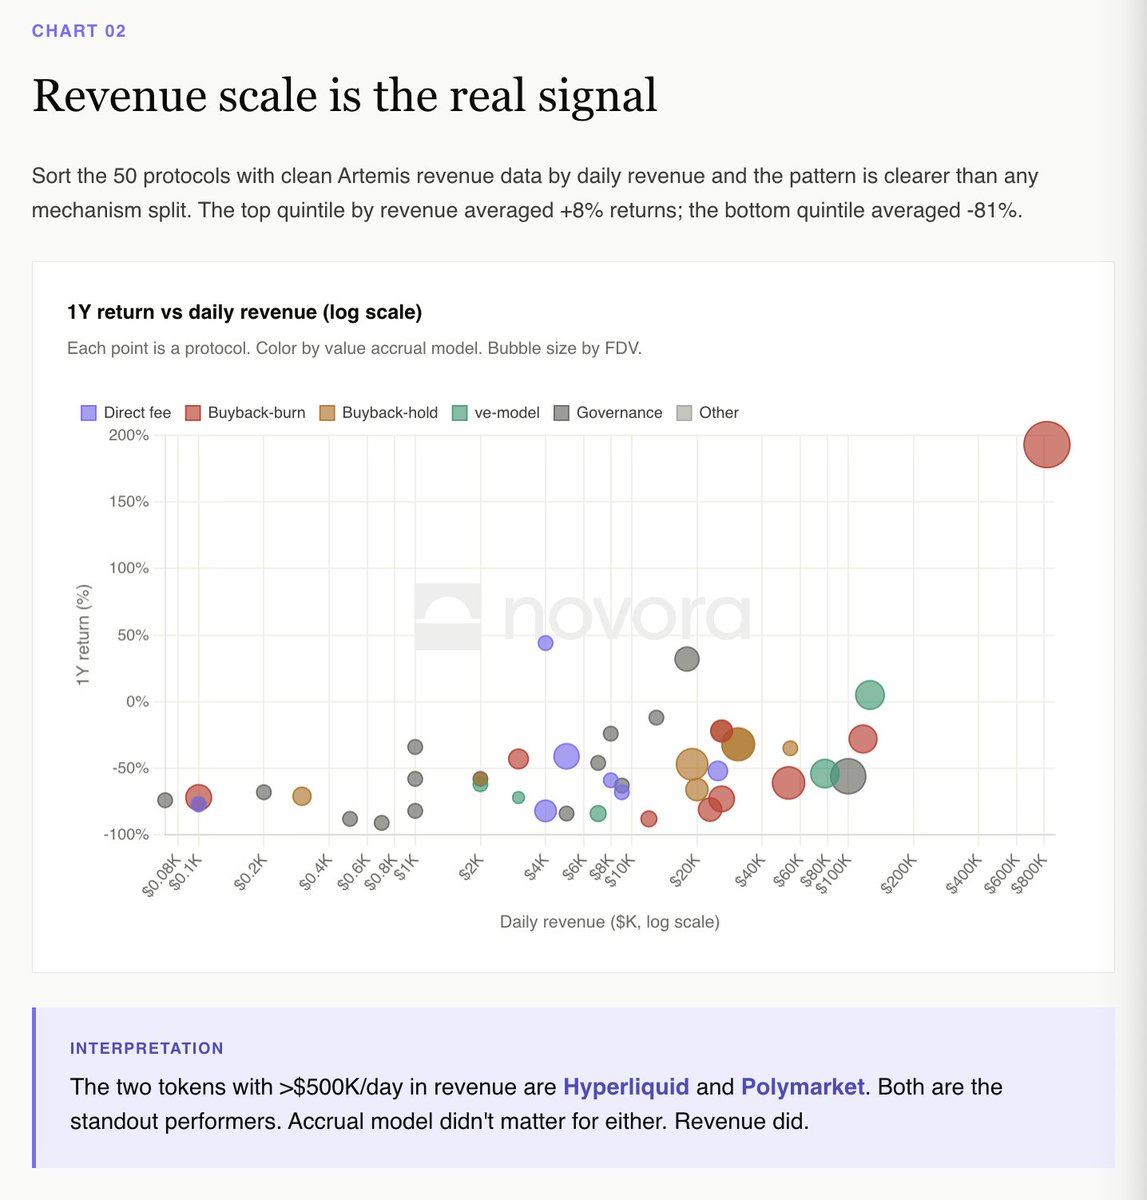
The 50 agreements with clear Artemis revenue data are ranked by daily revenue, and the pattern is clearer than any mechanism.
The top one-fifth agreement ranked by revenue had an average return of +8%. The minimum one-fifth average is -81%.
Two agreements with daily revenue of over $500,000 are Hyperliquid and Polymarket. Both are prominent performers in the data set. They have different accumulation models, but they have the same revenue trajectory.
dYdX paradox vs Hyperliquid paradox
Direct cost allocation is the easiest model for institutional allocators to read because it clearly maps to dividends. dYdX runs the textbook version: 100% transaction fees to stakers, 75% net revenue buyback, and the best investor relations infrastructure.
dYdX is down 82% over the past 12 months. The mechanism worked exactly as promised, but the business did not.
Hyperliquid is the opposite. Through aid fund buyback and destruction (99% fee), zero traditional investor relations infrastructure, +193% per annum.
If you are an allocator, this is the clearest interpretation in the data set: you are buying part of the protocol's revenue, and if revenue falls, the token will also fall. The mechanism is a basic requirement; the revenue trajectory is everything.
The ve model requires permanent bribes to work
Aerodrome is the only ve model token in the data set with a positive 1-year return (+5%). The mechanism relies on inflows from the Base ecosystem to maintain the bribery market.
Velodrome, Curve, Balancer, and every smaller ve fork all dropped by -54% to -84%. The ve flywheel works, but the flywheel requires ongoing new capital. When capital flows stop flowing in, the entire structure falls apart.
This is not a criticism of the model. Instead, it is acknowledged that VE tokens are leveraged bets on ecosystem inflows, not necessarily on pure protocol fundamentals.
Mixed category average -71%
Credit programs, RWA, LRT, memecoin, stablecoins. 62 agreements. The most heterogeneous category in the data set. Average 1-year return: -71%.
This is the destination of most 2024-2025 launch projects: EtherFi, Renzo, Puffer, Virtuals, AI16Z, the entire LRT queue, the memecoin queue. These tokens rely on storytelling and TGE airdrop transactions, not on cash flow mechanisms. Once the airdrop is unlocked, there's nothing to support the price.
Investor readability is a fundamental issue. The provisioner cannot insure a token whose accumulation mechanism relies on future narratives.
panoramas
Average 1-year return by cumulative model:
Buyback destruction: -35% (driven by Hyperliquid; -56% without HYPE)
Repurchase holdings: -52%
Direct cost allocation: -55%
Pure governance: -65%
Voting hosting (ve model): -67%
Other/Blend: -71%
Of the 135 agreements with empirical performance data, 5 closed in the past year. median return: -66%.
What does this mean
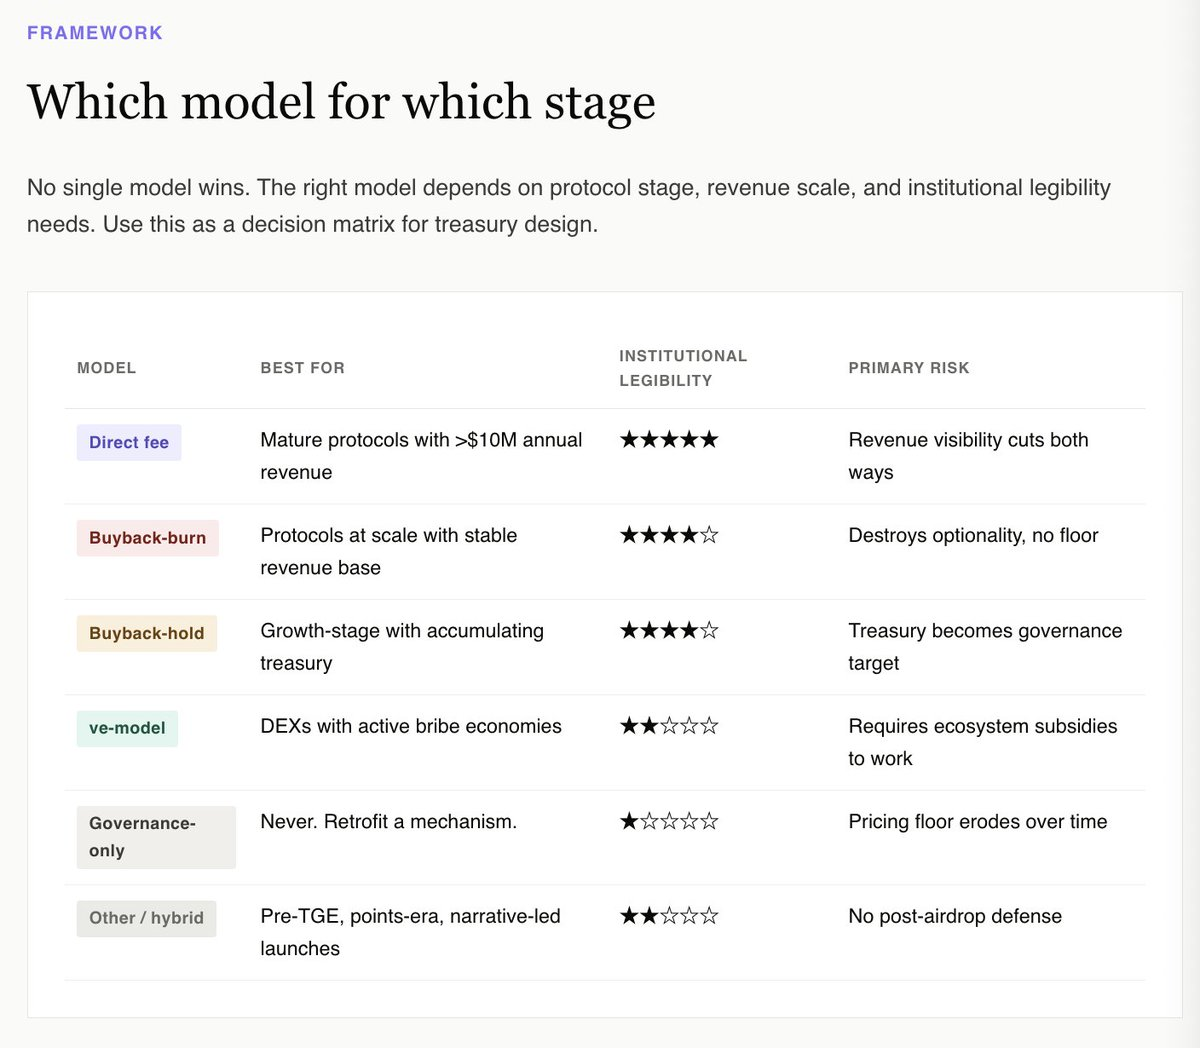
The market won't pay a premium for good mechanism design, but it will punish tokens that have no mechanism at all.
The clearest empirical interpretation of 2025 is that value accumulation did not generate excess returns; revenue was generated. But the 48 pure governance protocols in the data set show the costs of not having a mechanism. When the market chooses between the tokens that pay you and the tokens that don't pay, it will choose the one you pay for.
For the treasury, the right question is not what kind of mechanism can maximize upside. The data shows that none of them can reliably do it. The right question is what kind of mechanism would make this token look investable from an institutional allocator's fundamental point of view.
This perspective immediately ruled out pure governance and mixed categories. It favors repurchase holdings with transparent treasury disclosure, repurchase and destruction (Hyperliquid) of large-scale agreements, direct fee allocation for mature revenue generation agreements, and a ve model that binds an active bribery market for a narrow range of DEX native tokens.
For all other tokens, including most tokens released in the past 24 months, the honest answer is: modify a mechanism before the next time it's unlocked. Do it while you still have a choice.
The full interactive report with all 159 protocols and filterable data sets is online:
https://www.novora.co/research/value-accrual-2026.html
This article is for informational purposes only and does not constitute financial, investment, or legal advice. All data has been verified from open sources as of April 2026. Novora may have an advisory relationship with the agreements mentioned in this report. Always do your own research and consult a qualified financial advisor before making an investment decision.
Twitter:https://twitter.com/BitpushNewsCN
Compare the TG exchange group:https://t.me/BitPushCommunity
Compare TG subscriptions:https://t.me/bitpush
