Lifeform · 25
Blockchain Gaming Research Report April 2024: Number of Active Users Reaches Record High Amid Market Downturn

Blockchain Gaming Research Report April 2024: Number of Active Users Reaches Record High Amid Market Downturn

April 2024 Blockchain Game Research Report Author: stella@footprint.network Data Source: GameFi Research Page In April 2024, the Web3 gaming sector experienced significant fluctuations after experiencing record performance in March. Bitcoin has pulled back from an all-time high, with a monthly decline of 10.4%. At the same time, the market value of blockchain gaming tokens also declined by 30.5%. However, in this context, the number of daily active users (wallets) climbed to a historic high of 3 million, highlighting the continued growth in user engagement under market challenges. The data for this report comes from Footprint Analytics' Web3 game research page. It's an easy to use dashboard containing the most important statistics and metrics for understanding the Web3 gaming industry, updated in real time. Looking back at the macro market in April 2024, Bitcoin retreated after hitting an all-time high of $73,068 in March. Starting at $71,229 on April 1, it had dropped to $63,839 by April 30, a decrease of 10.4%. The situation is similar for Ethereum, which opened at $3,643 at the beginning of the month and fell to $3,215 at the end of the month, a decrease of 11.7%. Data source: Bitcoin and Ethereum prices Overall, there were many positive events in the industry in April. Bitcoin successfully halved on April 20. US senators have put forward proposals for stablecoin regulation, which indicates that the regulatory environment may usher in a more clear situation. In addition, there was an incident this month where former Binance CEO Zhao Changpeng was jailed for four months for anti-money laundering violations. The “Binance incident” came to an end, which also marked the increasingly clear regulatory thinking of the centralized exchange industry. Despite many months of continuous growth, the price of Bitcoin fell in April. Ethereum's performance still lags behind Bitcoin, probably because investors are uncertain about the prospects for an Ethereum ETF to be approved in the US market. This reflects a general slump in market sentiment. Public statements from US Federal Reserve system officials show that the possibility of interest rate cuts is declining, which coincides with rising economic indicators such as employment and consumer price index (CPI). Furthermore, Uniswap Labs and Consensys have successively received Wells Notices (Wells Notices) from the US Securities and Exchange Commission (SEC), and decentralized finance projects are facing regulatory challenges. Blockchain Gaming Market Overview In April, the market value of blockchain gaming tokens fell to $16.6 billion, a 30.5% drop. This trend is largely influenced by the overall trend of the cryptocurrency market and the performance of Bitcoin. Data source: Blockchain games and Bitcoin market capitalization The average daily transaction volume of blockchain games reached 8.6 million, down 16.7% from March, and far below the peak of around 25 million transactions in the third quarter of 2022. Data source: Blockchain game daily transactions However, the average number of daily active users (wallets/players) in April reached 3 million, an increase of 16.9% over March, reaching a record high. Data source: Number of daily active users of blockchain games In April, the number of active games on various blockchains reached 1,572, with BNB Chain, Polygon, and Wax leading the way with 25.8%, 19.5%, and 15.6% market shares. Data source: Number of daily active blockchain game users on each public chain (Author's note: Some games are deployed on multiple chains, and multiple calculations are performed on different chains when calculating the total number of games.) Of the 3 million daily active users, Ronin, Polygon, and Near rank among the top. Ronin continued to lead the way, growing its market share from 25.9% at the beginning of the month to 29.2% at the end of the month. Near's market share also increased significantly, jumping from 6.4% to 11.3%, while Klaytn's market share increased from 2.9% to 6.2%. In contrast, the share of the BNB chain fell from 9.1% to 7.4%. Also, due to its Web3 gaming campaign...


828d agoFootprint Analytics#DeFi, GameFi, social, metaverse #blockchain
Web3 Gaming Weekly Report (3.24-3.30)

Web3 Gaming Weekly Report (3.24-3.30)

[3.24-3.30] Web3 game industry news: Web3 development platform Mirror World launches first game rollup chain NFT card game Parallel completes $35 million in financing, Solana Ventures and others participate in crypto game development company Gunzilla Games to complete $30 million financing Telegram game Notcoin announces tokenomics overview : No private equity round, provided by default to gamers, Astar Founder: The new public chain developed by Sony in the future will focus on many fields such as games or NFTs Chainalysis CEO: Gaming is the key to the development of the Japanese crypto asset industry [3.24-3.30] Web3 game ranking: Weekly Chain Game Trading Volume Growth Top 10: Pomerun, MetaCene, Fighter Meta, Cryptopolis, StarSharks, Tap Tap , Aavegotchi, Fayda, Bomb Crypto, CryptoMine Space X Chain Game Trading Volume Growth Weekly Top 10: OneRare, Trade Race Manager 2: Rich Racer, Starcadia, Lifeform, Kratos Studios, MetaCene, The King of Fighters Arena, Gaimin, MFL, Castle Crush Weekly Active Player Growth Top 10: Kratos Studios, Lifeform, Trade Race Manager 2: Rich Racer, Gaimin, TURNUP, Ninneko, Bomb Crypto, QORPO WORLD, Ebisu's Bay, Apeiron Weekly Token Growth Top 10: Aavegotchi, KAKA NFT, Crypto Unicorns, Kryptomon, Arcona X-Reality Universe, DeathRoad, Sunflower Land, CroSkull, STEPN, Dvision Network____________The content of this article is for industry research and communication purposes only, and does not constitute any investment advice. The market is risky, so you need to be careful when investing. Footprint Analytics is a blockchain data solutions provider. Using cutting-edge artificial intelligence technology, Footprint Analytics provides the first codeless data analysis platform in the crypto field and a unified data API, allowing users to quickly retrieve NFT, game, and wallet address fund flow tracking data from more than 30 public chain ecosystems. Product Highlights: Data API for developers Footprint Growth Analytics (FGA) big data batch download feature for GameFi projects All data sets provided by Batch DownloadFootprint Check out our Twitter (Footprint_Data) for more product updates...

871d agoFootprint Analytics#NFTs #Solana #WEB3 #gaming
Web3 Gaming Weekly Report (3.17-3.23)

Web3 Gaming Weekly Report (3.17-3.23)

[3.17-3.23] Web3 game industry news: Saga announces the establishment of a Web3 game distribution department, Saga OriginsWeb3 game platform portal announced that it will open a staking function STP to launch the Base-based AI-based AI-enhanced game Layer3 CliqueMerlin ecosystem game project BitRealms completes the Pre-Seed round of financing Telos launches Tekika airdrop campaign before the game sidechain is released Gas Hero Intends to Execute 25 Million GMT Airdrops to the Gaming Community [3.17-3.23] Web3 Game Ranking: Weekly Chain Game Transaction Volume Growth Top 10: CryptoMine Space X, Tiny World, Crazy Defense Heroes, Decentraland, Heroes, AstarFarm, ETHXY, TRACER, XCAD Network, MOBOX Chain Game Trading Pen Weekly Growth Weekly Top 10: Lifeform, Apex Conquest, Kryptomon, Trade Race Manager 2: Rich Racer, Zeeverse, Bomb Crypto 2, ETHxY, Yomi Block Puzzle, Sui 8192 Game by Ethos, The Beacon Chain Game Active Player Growth Weekly Top 10: Lifeform, Smart Cats, Taki, My Pet Hooligan, Bitcoin Cats, ZPET - Zino Pet, BinaryX, Hippo Dash by Gameta, Arcade Champion, Wild Forest Weekly Token Growth Top 10: Block Ape Scissors, Fabwelt, Rebel Bots, Crazy Defense Heroes, Phantom Thoughts, Pizza Game, Bullieverse, Gamee, Walken, KAKA NFT____________The content of this article is for industry research and communication purposes only, and does not constitute any investment advice. Markets are risky, and investments need to be cautious. Footprint Analytics is a blockchain data solutions provider. Using cutting-edge artificial intelligence technology, Footprint Analytics provides the first codeless data analysis platform in the crypto field and a unified data API, allowing users to quickly retrieve NFT, game, and wallet address fund flow tracking data from more than 30 public chain ecosystems. Product Highlights: Data API for developers Footprint Growth Analytics (FGA) big data batch download feature for GameFi projects All data sets provided by Batch DownloadFootprint Check out our Twitter (Footprint_Data) for more product updates...

877d agoFootprint Analytics#Gamefi #WEB3
Stop supporting, separate markets, and NFT exchanges are in trouble

Stop supporting, separate markets, and NFT exchanges are in trouble

Low-threshold NFTs are on the rise, and these assets have less individual value but can attract a wider audience, thereby influencing overall market metrics. Author | Jessica Editor | Hao Fangzhou On August 19, after measuring gains and losses, OpenSea announced that it would stop supporting BNB Chain because the cost of support had already exceeded the return. The decision was made when OpenSea added support for L2 such as Base and Zora, and some people are wondering if BNB Chain is cooling down. But actually, it's not BNB Chian that's cool, but OpenSea, which relies on NFTs to eat. From a data perspective, the cryptocurrency market is now in a deep bear, and NFTs are experiencing a wider recession. According to DappTrader data, in August, the volume of NFT transactions fell 16% to $559 million, and the number of transactions fell 13% to 3.2 million. Second, let's take a look at OpenSea's revenue, which mainly comes from 2.5% transaction fees, which also peaked in January 2022. OpenSea's monthly transaction volume reached 4.8 billion US dollars, which brought OpenSea a monthly gross profit of 120 million US dollars. In February 2023, the monthly transaction volume was reduced to $657 million, and gross profit was as low as $16.43 million per month, but in August 2023, the monthly transaction volume was only $105 million, and gross profit was as low as $2.63 million per month. The volume of NFT transactions has dropped drastically, and to make matters worse, OpenSea's market share is also shrinking. Revenue and market share have declined sharply, which makes it really difficult to support more ecological NFTs. Other than that, it is also related to the decline in OpenSea's share of the BNB Chain chain. According to statistics from 2022 to July 2023, Ethereum almost accounts for most of the trading volume on Opensea, and only 0.8% during the peak of BNB Chain (2022/11). On August 18, OpenSea announced changes to creator royalties, abolish permanent royalties, and add 2.5% -10% optional royalties to secondary sales. Some community users believe this move harms artists' continued income. Yuga Labs announced that in view of the discontinuation of mandatory royalties announced by OpenSea, it will After February 2024, an optional creator royalty program will be implemented for all NFT secondary sales, and Yuga Labs will phase out support for all upgradable contracts and new series of OpenSea SeaPort, with plans to collaborate with OpenSea in February 2024...

1070d agody zhang#BNB Chain #NFTs #OpenSea #Yuga Labs #Ethereum #Binance #Binance Coin #Platform coins #Bitcoin
Crypto Rank Releases Top 10 NFT Market Trading User Rankings: OpenSea First Element Fifth

Crypto Rank Releases Top 10 NFT Market Trading User Rankings: OpenSea First Element Fifth

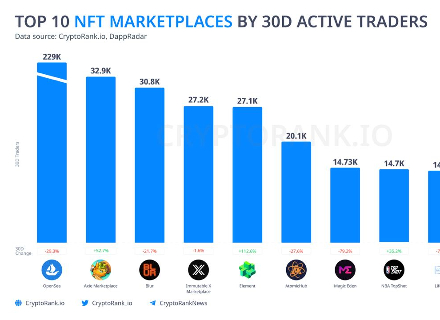
Original title: OpenSea Ranks First in the Top 10 NFT Marketplaces by Number of Traders Original Article Source: coinedition Author: Rawan Alamin Compiled by: Yvonne On August 24, crypto market insight and analysis platform Crypto Rank shared the top ten NFT markets based on 30-day active traders. OpenSea topped the list, with 229,000 30-day trading users, followed by Axie Marketplace and Blur. Source: CryptoRankOpenSea is considered one of the largest NFT marketplaces. The platform offers a variety of NFTs and is ranked first with 229,000 active traders for 30 days. OpenSea raised a total of $425 million in five funding rounds. The Axie Marketplace is in second place, with 32,900 transactions, an increase of 52.63% over the previous month. As of now, the market's trading volume is $1.67 million. The Axie Marketplace is a marketplace for the game “Axie Infinity,” where players can buy NFTs to use in the game. Blur is the third-largest NFT market, with a total of 30,800 active traders for 30 days, down 21.8% from the previous month. Blur currently has sales of $2525.7 million. Despite roughly the same number of traders, Immutable X Marketplace outperformed Element and ranked 4th in the top 10 NFT markets for the number of active traders on the 30th. Immutable X had 27,200 active traders in the past 30 days, while Element had 271,000, ranking fifth, with a significant increase of 113.31% over the previous month. AtomicHub is in sixth place, with 201,000 traders, down 27.29% from the previous month. Magic Eden ranked 7th, with 14,730 active traders on the 30th, down 79.33% from the previous month. NBA Top Shot is the 8th largest NFT marketplace based on the number of active traders in 30 days. This market, which offers art collectibles from the world's top basketball leagues, has a total of 14,720 traders, an increase of 35.36% over the previous month. LifeForm and JPG Store ranked ninth and tenth, respectively. Lifeform had 14,300 traders, down 78.55% from the previous month, while JPG Store had 13,900 active traders...

1093d agody zhang#Blur #Crypto rank #element #NFTs #OpenSea
RootData: Which agencies love to lead investors? Which agencies are taking the most action this year?

RootData: Which agencies love to lead investors? Which agencies are taking the most action this year?

This article will explain the influence and level of activity of cryptographic institutions from data such as cumulative lead investment and number of launches in 2023. Among them, institutions such as Foresight Ventures, Hack VC, and Bitkraft Ventures showed a more active attitude. Author of the original article: Gu Yu & Cookie For venture capital institutions, the number of shots taken is one of the important criteria for measuring their activity, and leading investment is one of the core elements of measuring their financial strength and belief, which is essential to drive the development progress of the project. In this article, RootData will use its database to count the number of orders and lead investors of venture capital firms this year to help readers better understand the current state of crypto venture capital firms. Historical top 10 leading investors, data source: RootData Since 2023, RootData statistics, 13 crypto venture capital firms have led more than 5 rounds this year, namely a16z Crypto, Polychain, Dragonfly, Blockchain Capital, Shima Capital, Hack VC, Binance Labs, Bitkraft Ventures, Jump Crypto, Blockchange Ventures, Hashed, Foresight Ventures, Greenfield Capital. Unfortunately, Pantera Capital, Paradigm, Multicoin Capital, and Framework Ventures are no longer on this list. Meanwhile, institutions such as Foresight Ventures, Hack VC, and Bitkraft Ventures showed a more active attitude. This article will explain the influence and level of activity of cryptographic institutions from data such as cumulative lead investment and number of launches in 2023. Crypto venture capital institutions that have invested more than 5 times in 2023 have led crypto venture capital firms that have invested more than 5 times in 2023. Data source: RootDataA16z CryptoA16z Crypto, as an Andreessen Horowitz (a16z) special fund, focuses on investments at all stages of Web3. So far, the capital management scale has exceeded 7.6 billion US dollars. The agency's well-known projects include Uniswap, OpenSea, Optimism, Lido, and Yuga Labs. Prior to the advent of cryptocurrencies, a16z had great success investing in companies such as Airbnb, GitHub, Skype, Stripe, and Twitter. a16z Crypto has led a total of 109 investments and invested in 15 projects this year, including 11 leading investments, including LayerZero, Worldcoin, YGG, etc. PolychainPolychain is a major global investor in cryptocurrency protocols and companies. In a Forbes 2022 interview with its founder, Polychain's capital reached $5 billion in 6 years, growing 1,250 times. Polychain is also an early investor in DeFi, such as Uniswap, Compound, MakerDAO, dYdX. Polychain has led 90 investments and has invested in 15 projects this year, including well-known projects such as Scroll, EigenLayer, PolyHedra, Berachain, and Connext. Dragonfly Dragonfly (already known as Dragonfly) is a leading global investment institution focused on cryptography, including Dragonfly Ventures, Dragonfly Liquid, and Metastable. Dragonfly launched a total of 3 crypto funds, which raised 1, 200, and 650 million US dollars respectively. The investment style is mainly DeFi. Its founder Feng Bo is a well-known investor in China. Dragonfly has led a total of 53 investments and has invested in 13 projects this year, of which...

1107d agody zhang#ANKR #Atom #Bitkraft Ventures #COMP #DeFi #DOT #Foresight Ventures #Hack VC #LEO #Lido #NFTs #OpenSea #optimism #Polychain #RootData #SOL #Uniswap #WEB3 #Yuga Labs #Ethereum
ZkSBT Revisited: The Value and Investment Logic of DID

ZkSBT Revisited: The Value and Investment Logic of DID

Previously, we wrote about DID (decentralized authentication) and zknFT/zkSBT usage scenarios. For details, see: What does on-chain DID mean in off-chain verification? Starting with the ASMatch application ZK Proof Key, we will discuss the future of zknFT/zkSBT in detail. In this article, we'll talk about what is zkSBT? What information does zkSBT obtain from users? And the value and investment logic of DID. What is zkSBT? zkSBT superimposes ZK technology on the existing SBT to achieve privacy and “simplicity.” About privacy. zkSBT is the Galxe OAT equivalent of privacy. zkSBT can only represent the holder meeting certain conditions. For example, zkBAB holders are BAB holders with real KYC information on Binance. zKarb holders are ARB airdrop winners. Other than that, no one can obtain any other information about zkSBT holders, including wallet addresses, historical transaction records, IP addresses, etc., not even the zkSBT issuer and Manta Network themselves. This is the great thing about ZK's privacy. About “brevity.” zkSBT broadens the boundaries of the use of ordinary SBT. After Mint zkSBt, users can obtain a Proof Key generated using ZK, and can fill in the Proof Key into other apps, or even Web2 apps, to verify DID within other apps. As a result, Web2 applications no longer need to connect to Web3 wallets such as Metamask, and can directly use Proof Key as user login verification. Another example is assuming that Galxe OAT also generated a Proof Key via ZK, and CyberConnect provides an entry point to verify the Proof Key. Then, Galxe and CyberConnect can exchange points. Assuming that Manta Network publishes an OAT task in Galxe, users get 100 points by doing the task, generate a Proof Key, and fill it in CyberConnect to prove that they have 100 points in the Manta Network activity. Other than proving that you have 100 points, CyberConnect can't get any other information, and it doesn't know what you've interacted with in Galxe. However, you can continue to complete Phase 2 tasks in CyberConnect. Proof Key is actually similar to Google Verification Code. Here's also a hint: don't reveal your Proof Key at will. Therefore, zkSBT adds privacy to the existing SBT and expands the application scenarios. The Mint process and usage are as convenient as SBT. The value of DID is perceived by DID projects; in fact, there are differences between users and organizations. The DID project lacks Degen parts, and users will feel that there is a lack of “gameplay.” Institutions, on the other hand, prefer DID projects. For example, Lifeform has just completed Series B financing at a valuation of 300 million US dollars, led by Binance Labs. In fact, DID platforms are user traffic entrances as well as user data entrances, such as Galxe, CyberConnect, and TaskOn. Manta Network NPO is actually a DID aggregator and DID middleware. One end connects the user and project party as the data provider, and the other end connects to other project parties as the demand side, such as Ultiverse, TaskOn, ReadOn, Yuliverse, Web3Go, zkPass, and LetsMeme, which will be the first batch of applications integrating zkBAb in the BNB chain ecosystem project. Since only Binance KYC users can use Mint BAB, and then Mint zKBab on the Manta NPO platform, zkBAB is equivalent to a user's KYC proof, proving that the user has actually done KYC. In reality, due to regulatory requirements, project parties need to use third-party KYC services to obtain services in certain countries...

1176d agoMantaNetworkProtocol#DID #manta_network #zkSBT
Deciphering the Different Chinese-Language Crypto Market: Real User Research, Chinese-Language VC Inventory

Deciphering the Different Chinese-Language Crypto Market: Real User Research, Chinese-Language VC Inventory

Publisher: TechFlow Deep Dive Article: 0xmin & Zolo & Min L Do you know the real Chinese-language crypto market? When the Chinese Coin and the Hong Kong concept came to the forefront, the Chinese-speaking market undoubtedly once again attracted widespread attention. Once upon a time, agencies/projects were still hesitating about whether to expand the Chinese-speaking market, and in the recent impact of the Hong Kong concept, they have also witnessed the strength of the Chinese language market that should not be underestimated. Compared to scattered analysis and second-hand information, we have direct communication with many partners, and based on TechFlow's long-term deep cultivation and insight in the Chinese-speaking market, we present comprehensive and interesting report content from the perspective of the market environment, user portraits, VC, and communication, and uncover unknown insider information. Whether you are an organization, project party, or individual, I hope this section of the report will help you quickly establish your understanding of the Chinese-language crypto market and help you expand your ecosystem. Thanks to Min L, co-author of this issue, market strategy director for the top ten global exchanges, ten years of experience in the global market, and co-founder of FAB DAO. *This article is an excerpt from the Chinese-language market section of the “Asia Pacific Web3 Truth” report produced by TechFlow. 1. Overview of the Chinese-language crypto market The largest in the Asia-Pacific market is the Chinese-speaking market. Its definition generally refers to all places with Chinese people, such as mainland China, Hong Kong, Taiwan, Singapore, Thailand, and Malaysia. According to the China Investment Network survey report, in addition to China, the 6 countries with the most Chinese are: Indonesia, number of Chinese: over 10 million Malaysia, number of Chinese: about 10 million Malaysia, number of Chinese: 7.4 million US, number of Chinese: 5.08 million Singapore, number of Chinese: 2.98 million Canada, number of Chinese: 1.77 million. Different encryption policies in various regions have also brought about different cryptographic user profiles. In September 2017, the People's Bank of China and other regulators announced a ban on ICOs and a notice to close cryptocurrency exchanges. In May 2021, the relevant regulators issued another notice to crack down on Bitcoin mining and trading. At this point, exchanges, project parties, miners, and users have all begun to go overseas. However, Chinese-speaking users are only migrating; they haven't actually disappeared. According to Triple A's data estimates, the global cryptocurrency ownership rate will average 4.2% by 2023 (including non-on-chain users). Among them, if only the Chinese-speaking regions are calculated: Mainland China 19.9 million, Hong Kong 0.18 million, Singapore 0.64 million, and Taiwan 0.54 million, the number of crypto users is 21.26 million. However, if this data includes the proportion of Chinese people in Indonesia, Thailand, Malaysia, the US, and Canada, it can be roughly calculated that the number of users that can radiate Chinese-language content is at least 23.57 million. (The calculation formula is crypto users in the region* (total number of Chinese speaking users in the region/total number of users in the region)) The concept we have always emphasized is the Chinese-speaking market, not the mainland China market. In addition to mainland China, there are still a large number of Chinese in Hong Kong, Taiwan, Singapore, Malaysia, North America, and Europe, and this group also has strong purchasing power. For any aspiring entrepreneur, you can say that you don't pay attention to the Chinese market due to policy or other reasons, but you can't ignore the Chinese market. Hong Kong is a bridgehead connecting the global Chinese market. At the same time, Taiwan is also a place we need to pay great attention to. Even if many projects want to enter the Chinese-speaking market, they will first use the Taiwanese market as a testing ground. Taiwan has decades of infrastructure and stable economic development, and an industrial structure with many small and medium-sized enterprises, which enabled the Taiwanese market to move towards a well-off and well-off society in the 1960s. Most post-80s Taiwanese have not experienced a life of “suffering to the point where they have nothing to eat.” Compared to the widening gap in the mainland economy and the rigidity of social classes in Japan, South Korea, and Hong Kong, the average salary of Taiwanese can at least meet basic needs. Therefore, Taiwanese users are more likely to “continue to accumulate assets” rather than become rich all at once. Therefore, long-term projects (such as lending, regular investment and financial management, DeFi strategies) and easy-to-understand trading products (such as grid trading, copy trading) will be more popular among Taiwanese users because they can steadily accumulate assets. On November 14, 2022, the FTX incident broke out, and the world's second-largest exchange went out of business...

1179d ago深潮TechFlow#Deep Tide TechFlow
Deciphering the Different Chinese-Language Crypto Market: Real User Research, Chinese-Language VC Inventory

Deciphering the Different Chinese-Language Crypto Market: Real User Research, Chinese-Language VC Inventory

Chinese-speaking users are just migrating; they haven't really disappeared. Do you know the real Chinese-language crypto market? When the Chinese Coin and the Hong Kong concept came to the forefront, the Chinese-speaking market undoubtedly once again attracted widespread attention. Once upon a time, the agencies/projects that were still hesitant about whether to expand the Chinese-speaking market have also seen the strength of the Chinese language market not to be underestimated in the recent impact of the Hong Kong concept. Compared to scattered analysis and second-hand information, we have direct communication with many partners, and based on TechFlow's long-term deep cultivation and insight in the Chinese-speaking market, we present comprehensive and interesting report content from the perspective of the market environment, user portraits, VC, and communication, and uncover unknown insider information. Whether you are an organization, project party, or individual, I hope this section of the report will help you quickly establish your understanding of the Chinese-language crypto market and help you expand your ecosystem. Thanks to Min L, co-author of this issue, market strategy director for the top ten global exchanges, ten years of experience in the global market, and co-founder of FAB DAO. * This article is an excerpt from the Chinese-language market section of the “Asia Pacific Web3 Truth” report produced by TechFlow. 1. Overview of the Chinese-language crypto market The largest in the Asia-Pacific market is the Chinese-speaking market. Its definition generally refers to all places with Chinese people, such as mainland China, Hong Kong, Taiwan, Singapore, Thailand, and Malaysia. According to the China Investment Network survey report, in addition to China, the 6 countries with the most Chinese are: Indonesia, number of Chinese: over 10 million, number of Chinese: over 10 million Malaysia, number of Chinese: 7.4 million, number of Chinese: 5.08 million Singapore, number of Chinese: 2.98 million Canada, number of Chinese: 1.77 million. Different encryption policies in various regions have also brought about different cryptographic user profiles. In September 2017, the People's Bank of China and other regulators announced a ban on ICOs and a notice to close cryptocurrency exchanges. In May 2021, the relevant regulators issued another notice to crack down on Bitcoin mining and trading. At this point, exchanges, project parties, miners, and users have all begun to go overseas. However, Chinese-speaking users are only migrating; they haven't actually disappeared. According to Triple A's data estimates, the global cryptocurrency ownership rate will average 4.2% by 2023 (including non-on-chain users). Among them, if only the Chinese-speaking regions are calculated: Mainland China 19.9 million, Hong Kong 0.18 million, Singapore 0.64 million, and Taiwan 0.54 million, the number of crypto users is 21.26 million. However, if this data includes the proportion of Chinese people in Indonesia, Thailand, Malaysia, the US, and Canada, it can be roughly calculated that the number of users that can radiate Chinese-language content is at least 23.57 million. (The calculation formula is crypto users in the region* (Chinese speaking users in the region/total number of users in the region)) The concept we have always emphasized is the Chinese-speaking market, not the mainland China market. Apart from mainland China, there are still a large number of Chinese people in Hong Kong, Taiwan, Singapore, Malaysia, North America, and Europe, and this group also has strong purchasing power. For any aspiring entrepreneur, you can say that you don't pay attention to the Chinese market due to policy or other reasons, but you can't ignore the Chinese market. Hong Kong is a bridgehead connecting the global Chinese market. At the same time, Taiwan is also a place we need to pay great attention to. Even if many projects want to enter the Chinese-speaking market, they will first use the Taiwanese market as a testing ground. Taiwan has decades of infrastructure and stable economic development, and an industrial structure with many small and medium-sized enterprises, which enabled the Taiwanese market to move towards a well-off and well-off society in the 1960s. Most post-80s Taiwanese have not experienced a life of “suffering to the point where they have nothing to eat.” Compared to the widening gap in the mainland economy and the rigidity of social classes in Japan, South Korea, and Hong Kong, the average salary of Taiwanese can at least meet basic needs. Therefore, Taiwanese users are more likely to “continue to accumulate assets” rather than become rich all at once. Therefore, long-term projects (such as lending, regular investment and financial management, DeFi strategies) and easy-to-understand trading products (such as grid trading, copy trading) will be more popular among Taiwanese users because they can steadily accumulate assets. On November 14, 2022, the FTX incident broke out, and the world's second-largest exchange...

1180d agody zhang#BNB Chain #NFTs #Solana #VC #WEB3
IOSG Weekly Brief | Post-Shapella — The Ethereum Staking Market Will Present a Dynamic Competitive Landscape #175

IOSG Weekly Brief | Post-Shapella — The Ethereum Staking Market Will Present a Dynamic Competitive Landscape #175

Post-Shapella — The Ethereum staking market will present a dynamic competitive pattern. This article is IOSG original content. It is only used for industry learning and communication, and does not constitute any investment reference. If you need to cite, please indicate the source. For reprinting, please contact the IOSG team for authorization and reprinting instructions. Special thanks to the IOSG Ventures R&D and post-investment team for their hard work! Author: Jiawei @IOSGTL; DrShapella has released liquidity, withdrawal pressure has been relieved recently, and is optimistic about pledge rates for a long time; event-driven, price war-oriented, and target customer differentiation, the Ethereum staking market will present a dynamic competitive pattern; DVT will enhance the robustness and stability of the Ethereum verification set; the influx of institutional investors will help diversify the set of Ethereum validators; although the pledge circuit has been around for a long time, changes brought about by some important events may still impact the current pattern and thus bring implicit investment opportunities. Introduction: After Ethereum transitioned to PoS in September last year, this year was immediately followed by two major protocol upgrades: Shapella and Cancun. The former mainly supports validators' withdrawals, making Ethereum staking a closed loop; the latter will introduce Data Blobs as an early stage for data fragmentation. It is now over a month until the successful implementation of Shapella. Due to the activation of withdrawals, there have been some changes and turns in the market. The author mainly writes this article based on recent first-level market observations, putting forward a few ideas on the Ethereum staking circuit and discussing investment opportunities in this circuit. Source: Dune Analytics @hildobby我们快速对市场情况进行浏览. Since Beacon Chain's staking was activated in December 2020, Ethereum staking has developed well. As of writing this article, it has accumulated more than 600,000 validators and approximately 20 million pieces of staked Ethereum (more than 36 billion US dollars at current price), and the network pledge rate is close to 17%. Source: Dune Analytics @hildobby当前, Liquidity accounts for 35.9% of all staking categories, with Lido alone taking 31% of the entire staking market. After large withdrawals were made by CEXs such as Kraken and Coinbase, CEX still occupied 22.7% of the market share. Source: Dune Analytics @hildobby由于Shapella激活了质押的退出通道, which inevitably caused market selling pressure. From the image above, we can see that after Shapella, there were significantly more ETH outflows than inflows. Withdrawal pressure was quickly relieved, and the net inflow of ETH has so far exceeded 1 million units. This is basically in line with Shapella's previous market predictions. Due to the release of liquidity, the author believes that Ethereum staking is still an attractive asset management target in the medium to long term, so I am still optimistic about the increase in the pledge rate. Post-Shapella — The Ethereum staking market will present a dynamic competitive pattern. Lido is currently the only dominant player in the entire staking market, mainly due to its first-mover advantage and the moat built around head effects. However, I don't think Lido will be the end of a mobile staking track or an entire staking track. Shapella was a turning point and a basic prerequisite for other staking protocols to compete with Lido. This section mainly discusses a few points of event-driven, price warfare, and target customer differentiation. Event-Driven Source: Dune Analytics @hildobby一些直接或间接的外部事件可能会导致质押市场格局变化. For example, escrow pledging services provided by centralized exchanges used to account for more than 40% of the market share in 2021, but with the development of liquidity staking, their market share was squeezed and recently showed an accelerated trend. We're guessing it might be due to the following two things: 1. After FTX went down in November last year, users' trust in centralized and hosting solutions declined. 2. In February of this year, due to regulatory pressure from the SEC, Kraken announced the termination of pledge services to US customers, leading to its withdrawal operations and further causing users to worry about staking service providers in specific jurisdictions. Source: Nansen After Shapella, early staking users were able to withdraw money and switch to other staking services — the top three entities in the withdrawal queue were all centralized exchanges reflecting this. Price War is in a liquid free market...

1183d agoIOSG#IOSG