


Uncover the signs of a sharp rise in BTC! 3 escape indicators to help you accurately capture the golden points of exit!

Author: Fuji
Edit:LEO
This article was co-authored by the Nubit community!
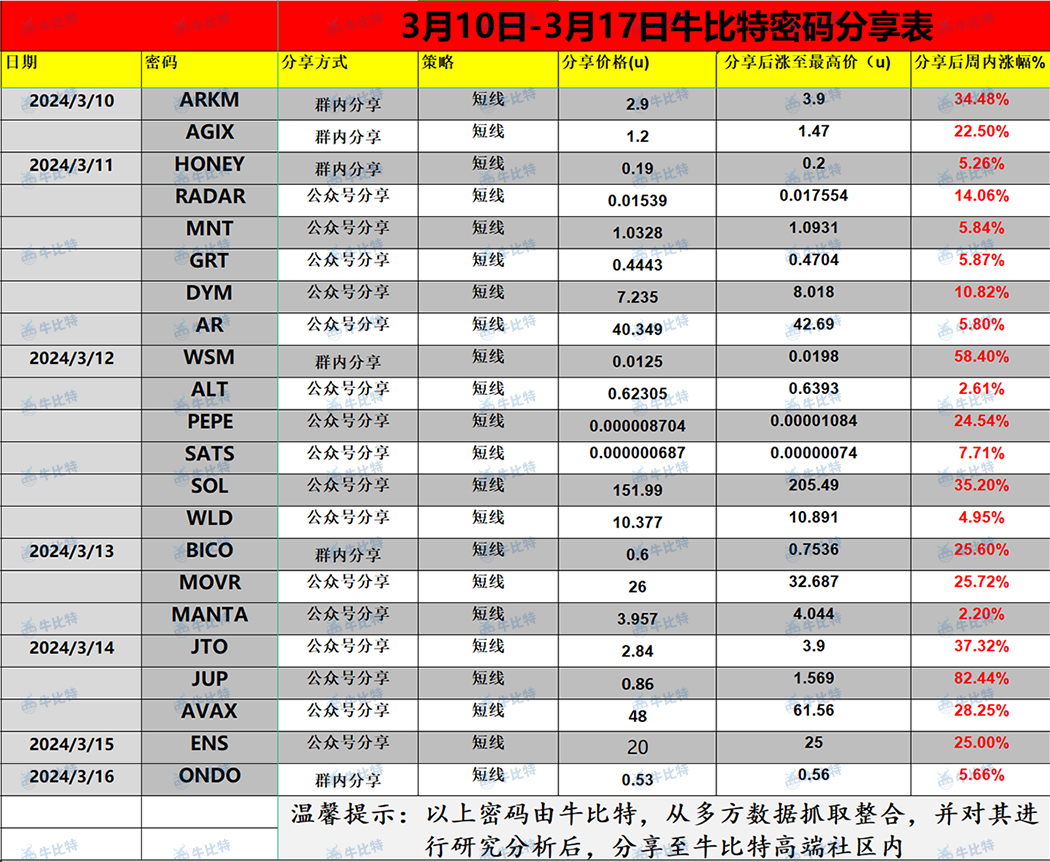
Currently, niubite.com (niubite.com)'s weekly win rate and profit margin can basically outperform most investors in the market.
Although the crypto market experienced a sharp decline this year (315), and many high-quality chips were sold at a discount, causing many investors' wallets to shrink, from a long-term perspective, the peak of this crypto bull market is far from here.
So, in the investment process, how can we judge the high point of the market so as to escape the peak in time? Share the following 3 escape indicators for your reference.
1, Pi Cycle Top Index (Pi Cycle Top)
Pi Cycle Top can be found at the following website:
https://www.coinglass.com/zh/pro/i/pi-cycle-top-indicator
https://www.lookintobitcoin.com/charts/pi-cycle-top-indicator/
Judging from historical data, the Pi Cycle Top Index (Pi Cycle Top) is relatively accurate in determining market cycle highs.
In the Pi cycle top indicator, it identifies the top and bottom of the market cycle by using Bitcoin's moving average DMA (a line representing the average price of an asset over a specific period of time, represented by SMA on some websites) over different time periods.
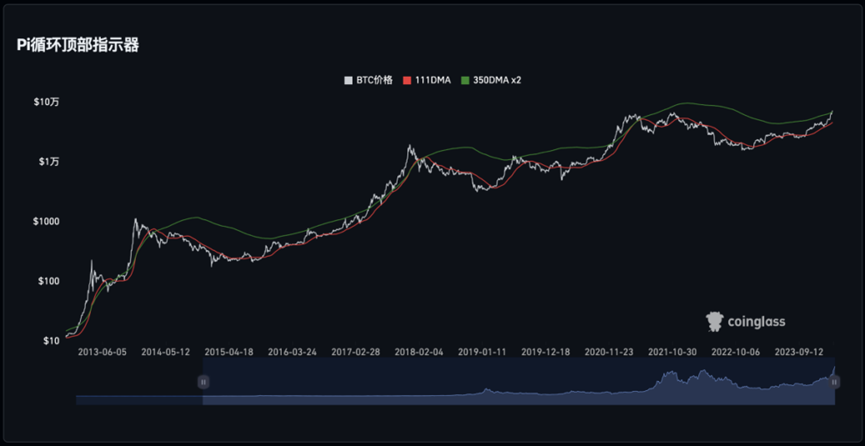
The Pi cycle top indicator mainly identifies the top of the market cycle by comparing the 111-day moving average (111DMA) and the 350-day moving average (350DMA).
Since 350 ÷ 111 = 3.153, it is just an approximation of Pi (Pi и 3.142), which is where the indicator's name comes from.
In actual application, the principle of Pi Cycle Top is to compare Bitcoin's 111DMA and 350DMA x 2 and find where they overlap to determine the top of the market.
In other words, when the 111-day moving average (111 DMA) and 2 times the 350-day moving average (350DMA x 2) coincide, it is considered a potential high point in the market, indicating that the price of Bitcoin is about to reach its peak price.

As can be clearly seen from the data of the past few market cycles, when the 111DMA continued to move upward and broke through the 350DMA x 2, the Bitcoin price reached the peak of the cycle, the market reached the top, and then the BTC price began to gradually decline.
There is the Pi Cycle Top indicator, and the corresponding one is the Pi Cycle Bottom indicator (used to determine the bottom of the market).
Pi Cycle Bottom identifies the market bottom through moving averages 471DMA and 150DMA. Interestingly, the ratio between them is 471/150 = 3.14, which is the value of Pi.
The Pi Cycle Bottom indicator compares Bitcoin's 150DMA and 471DMA x 0.745 to find where they overlap to determine the bottom of the market.
As can be seen, 2x is used in the Pi Cycle Top indicator and 0.475x is used in Pi Cycle Bottom.
The reason for using 2x and 0.745x is mainly tested through historical data. Judging from historical data, the intersection of DMA multiplied by these two multiples most accurately reflects the lowest point and highest point of the Bitcoin price. Therefore, they have always been used in the Pi Cycle Indicator indicator.
2, time period
Let's take a look back at the previous halving times and the number of days it took to reach historic price highs.
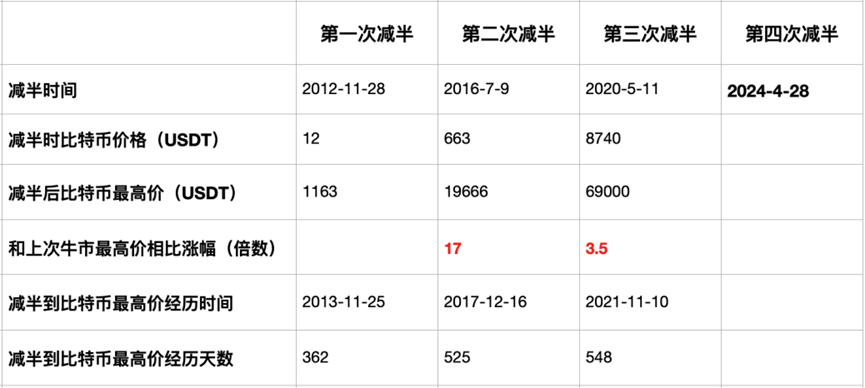
The first halving occurred in November 2012, when the price was $12 and reached a cyclical price peak of $1,163 after 362 days of halving (November 25, 2013).
The second halving occurred in July 2016, when the Bitcoin price was $663 on the day of the halving, then reached a cyclical price peak of $525 (December 16, 2017) of $19666.
The third halving occurred in May 2020, when the Bitcoin price was $8,740. After 548 days (November 10, 2021), the Bitcoin price reached a cyclical high of $69,000.
As can be seen from the above historical data, the number of days before halving the peak price cycle continues to move backwards. The first time was 362 days, the second was 525 days, and the third time was 548 days. According to this estimate, after this halving in 2024, the Bitcoin cycle price peak will occur in December 2025.
However, compared to the previous halving market, this year's halving market did move a bit faster due to the combination of the epic benefits of spot Bitcoin ETFs.
For example, before this halving occurred (end of April), the BTC price broke through the previous cycle's high ($69,000).
However, in the previous halving market, it was only a few months after the halving occurred that it broke through the high point of the previous round of the bull market cycle.
For example, it halved on June 7, 2016, broke through the peak cyclical price of the previous round of the bull market 7 months later, halved on May 11, 2020, and broke through the cyclical peak of the previous round of the bull market 7 months later.
It can be seen that in this halving in 2024, the time to break through the previous price highs was 8 months ahead of schedule, and the market moved significantly faster. This may shorten the duration of the bull market.
But we should also note that since the US SEC has passed the spot Bitcoin ETF, more and more institutions will enter the market, and more countries will approve the corresponding spot Bitcoin ETF products, which may prolong the current bull market.
Based on this, we can roughly speculate that the price of BTC in this bull market may be around October 2025, which is a year and a half until now.
3, 2025 peak (BTC) market capitalization range
Judging from historical data, during the peak of the bull market in December 2017, the total market value of crypto was 535.5 billion US dollars. During the peak bull market in November 2021, the total market value of crypto was 2.62 trillion US dollars.
From the peak of the bull market in 2017 to the peak of the bull market in 2021, the total market capitalization of the crypto market increased 4.89 times.
However, it is worth noting that as the size of the crypto asset market continues to expand, the multiples of its market capitalization growth show a gradual decline, and the growth rate may not be as rapid as in the past.
But on the other hand, as spot Bitcoin ETFs and the global crypto compliance process advance, cryptocurrencies will gradually become one of the mainstream asset allocation options. This trend provides new impetus for the future development of the crypto market.
Combining the above factors, the peak market capitalization of the bull market in 2025 is expected to grow between 3.2 times and 4 times. Therefore, the total market value of crypto is expected to be in the range of 8.38 trillion to 10.48 trillion yuan.
Let's take another look at the market capitalization share:
In 2017/12 (peak of the bull market), BTC accounted for 43.28% of market capitalization, ETH accounted for 15.05% of market capitalization, and USDT accounted for 0.25% of market capitalization.
In November 2021 (peak of the bull market), BTC accounted for 41.62% of market capitalization, ETH accounted for 19.32% of market capitalization, and USDT accounted for 2.68% of market capitalization.
As can be seen, at the peak of the bull market, BTC's share of market capitalization was relatively stable, remaining around 42.45%.
Thus, we can estimate the market capitalization of BTC in the range: $3.55 trillion - $4.48 trillion.
The corresponding BTC price range is: 178,000 US dollars - 222,400 thousand US dollars.
The above valuation range and market capitalization range that escaped the peak in 2025 mainly refers to Rocky's Twitter content. I would like to thank them.
In short, the above three indicators are all escape references based on historical data, but we must recognize that every round of the crypto bull market is unique and will be accompanied by new variables and influencing factors. Taking this round of the bull market as an example, the launch of a spot Bitcoin ETF is an unprecedented major variable. It may have a profound impact on the crypto market and change the operating rules of the market.
Therefore, while referring to these indicators, we also need to pay close attention to market trends and respond flexibly to various new variables and challenges. These escape indicators only provide us with a reference framework. In the investment process, we also need to conduct comprehensive and in-depth analysis and judgment based on the specific situation of the current market.
P.S.This article does not constitute investment advice!
