


After three consecutive quarters of decline, why hasn't the crypto market bottomed out yet?
Author: Little Cake
Original title: After three consecutive quarters of decline, the crypto market is experiencing its longest decline since 2022
pursuantCoinGecko's previous Q2 2026 crypto industry reportThe data is grim: the total market capitalization of the crypto market fell 12.6% in the second quarter, shrinking from $2.4 trillion to $2.1 trillion, the lowest level since September 2024, and retreated about 52% from the peak in October 2025. This is the third straight quarter of decline.
In this 58-page report, it's not a single number that's worth most attention; it's several trend lines pointing in the same direction at the same time:资Kim is leaving the crypto market, and in a very orderly manner.
Triple evidence of capital outflows
The first proof comes from stablecoins.
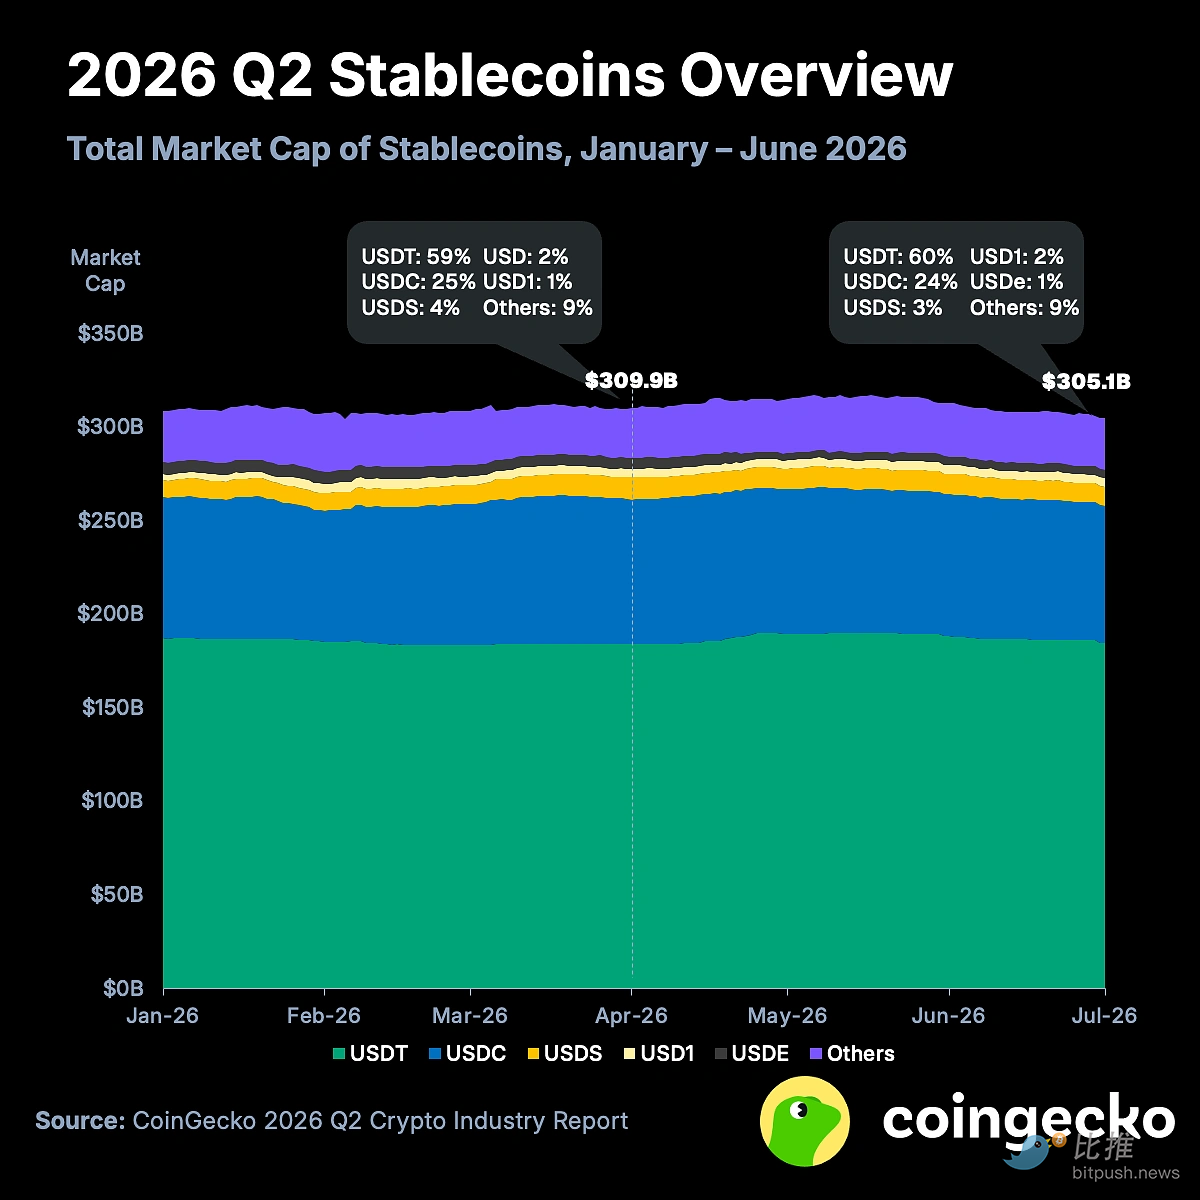
The total market value of stablecoins fell 1.6% to $305.1 billion in the second quarter, the first negative quarterly increase since the third quarter of 2023. Stablecoins are the “cash layer” of the crypto ecosystem. Their shrinking means that capital is no longer satisfied with withdrawing from risky assets to safe haven in the market; they are directly withdrawing from the industry.
Structural differentiation is also intensifying. Tether's USDT bucked the trend and rose slightly to 60%, while Circle's USDC outflow was $3.7 billion (-4.8%), Sky's USDS shrunk by $2 billion (-16.4%), and Ethena's USDe shrank by $1.4 billion (-24.4%). This pattern shows two things: demand for offshore dollars is still stable, but on-chain native yield stablecoins are experiencing a wave of redemptions. The core reason is that DeFi yields have fallen below risk-free interest rates.
The second evidence comes from trading volume.
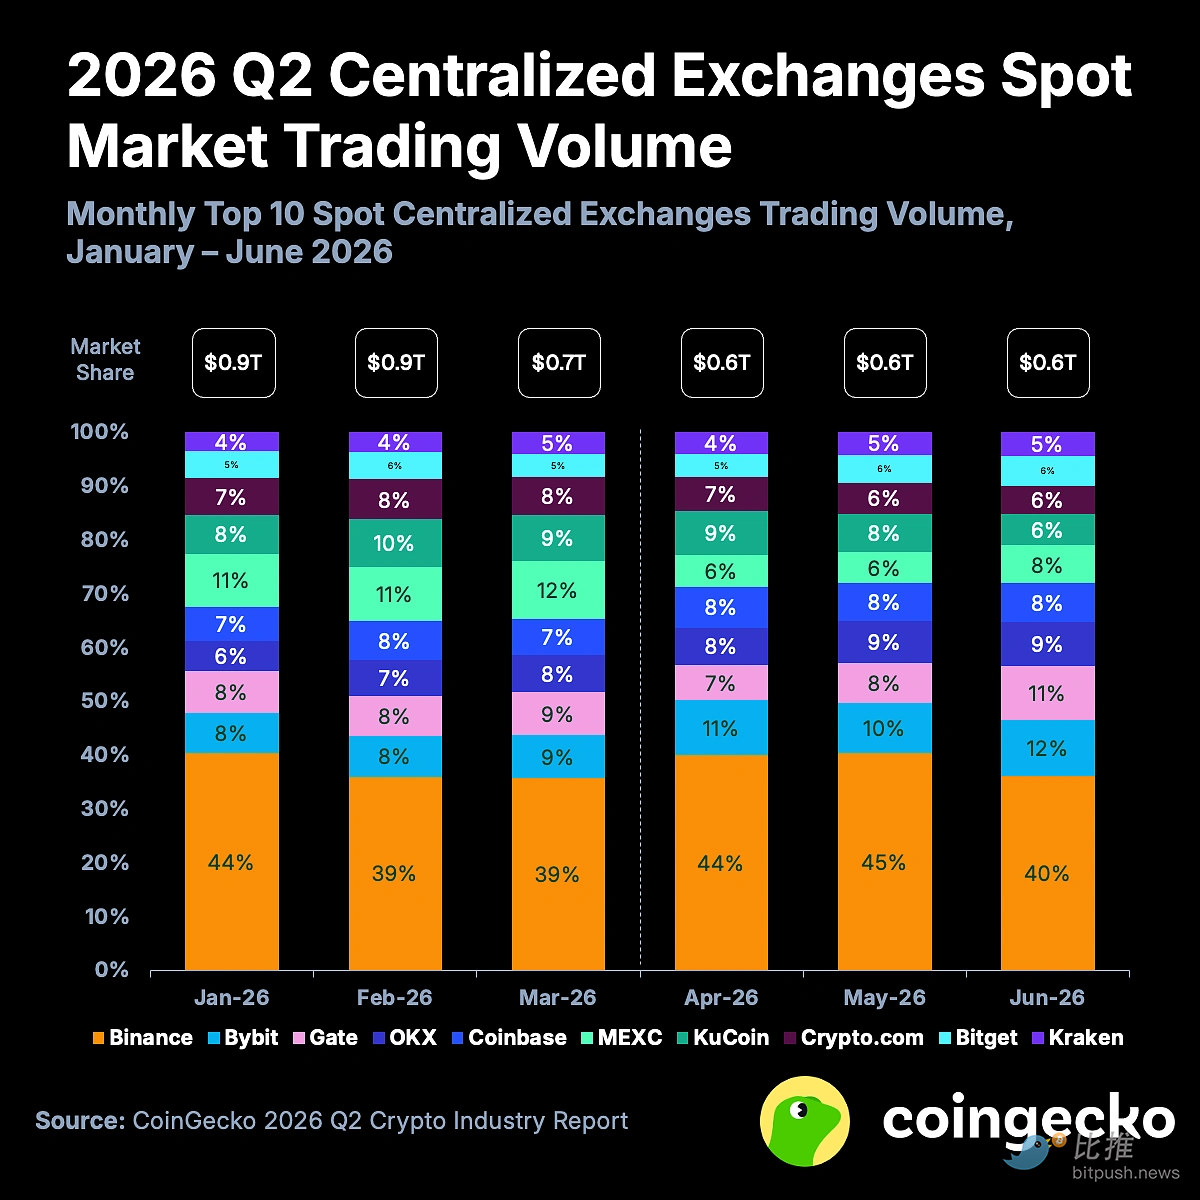
Spot trading volume on centralized exchanges fell 27.9% to 1.95 trillion US dollars in the second quarter. In May, it was only 619 billion US dollars in a single month, the lowest point in the year. The relatively moderate decline in perpetual contract trading volume (-10% to $12.7 trillion) is not good news; it indicates that speculative demand is declining more slowly than investment demand, and the market structure is becoming more fragile.
The third piece of evidence comes from DeFi.
Total DeFi hedging volume (TVL) plummeted 23.4% in the second quarter. Ethereum was most affected by the KelpDAO attack, with TVL shrinking by 28.7% (-$150 billion) and market share falling to 52.9%. The decline in lock-up volume is compounded by an average decline of 44.6% in on-chain fees, and overall on-chain economic activity is shrinking.
BTC and ETH are left behind at the same time
If we only look at the total market capitalization, the 12.6% drop is only moderate in terms of the volatility of the crypto market. What is really unsettling is the divergence between crypto assets and traditional risk assets.
US stocks showed a strong rebound in the second quarter, while Bitcoin (-14.2%) and Ethereum (-25.4%) did not keep up at all.
This is an important structural sign: the “Bitcoin is a digital gold/risk asset/technology stock alternative” narrative for the past two years has simultaneously failed during this quarter. It neither followed the rise of gold nor the Nasdaq, nor acted as a safe haven when risk aversion heats up.
Ethereum is in a worse position.
The second quarter was the first time in ETH history that it had three consecutive quarters of decline. With Bitcoin's market share remaining above 55%, Ethereum's share has fallen to around 10%, far below the historical average of 18%.
June was the worst month of the quarter. The combination of the hawkish stance of the Federal Reserve, the repeated situation between the US and Iran, and the strategic symbolic sale of Bitcoin have all triggered the sharpest monthly decline in the year. Strategy sold only 32 BTC (worth about $2.5 million, accounting for 0.0038% of its holdings), but it broke Saylor's “never sell” belief narrative, with a cumulative outflow of nearly $4 billion from US-listed Bitcoin ETFs over the next 12 trading days.
Few highlights
In an overall shrinking market, a few corners are still growing, but the direction of growth is intriguing.
The market's nominal trading volume is predicted to increase by 48.7% to US$113.8 billion in the second quarter, reaching a record high of US$52.8 billion in June.
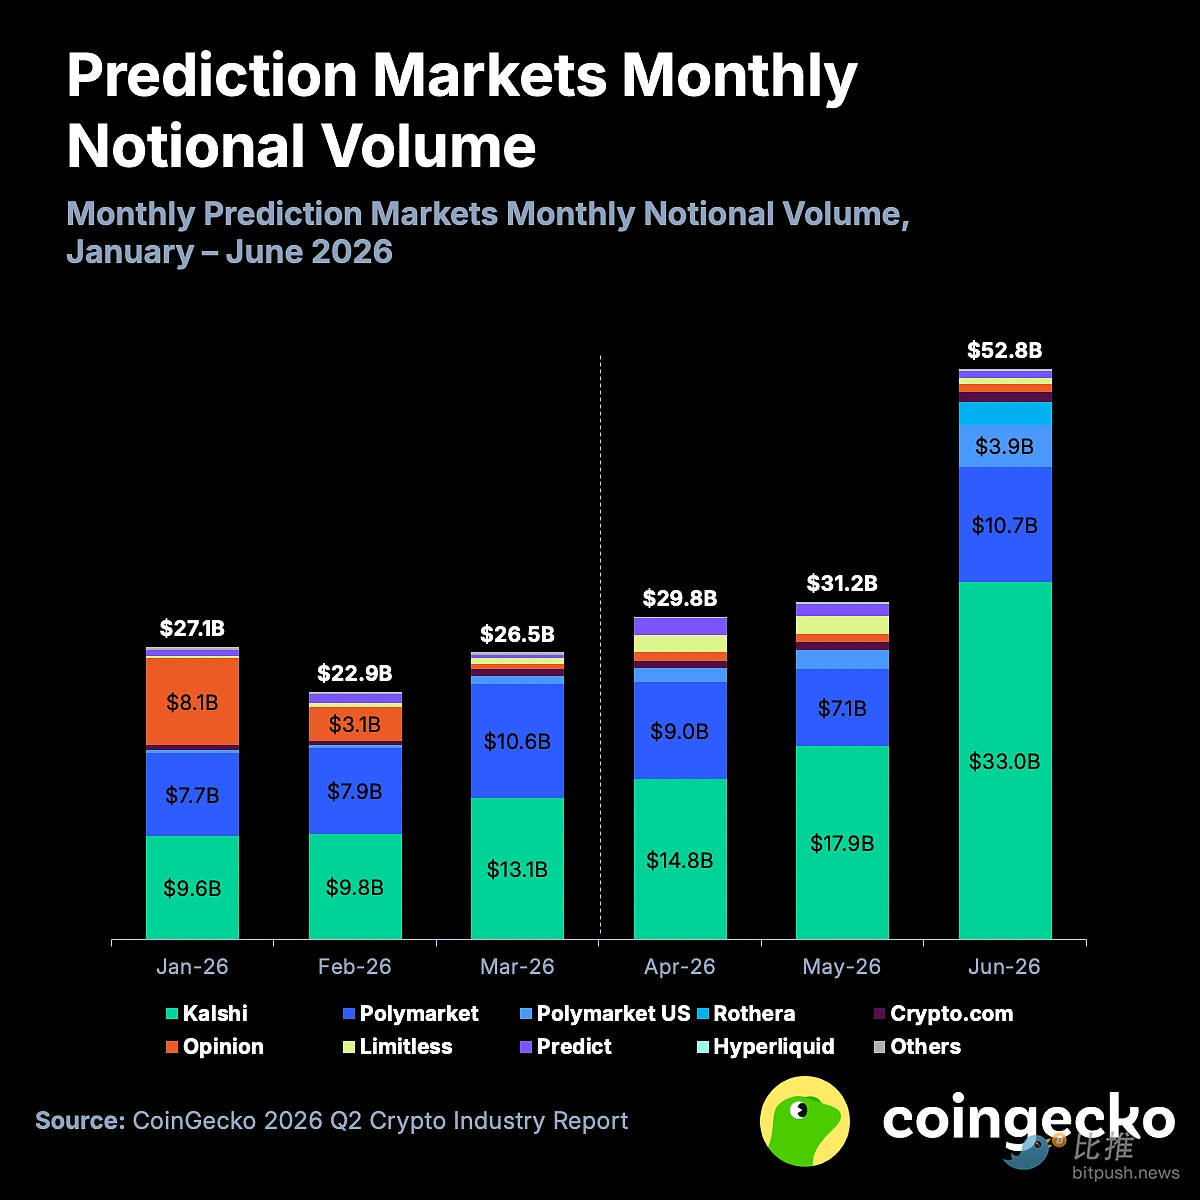
Kalshi's market share increased from 42.4% to 58.9%, while Polymarket declined from 35.8% to 30.2%. Rothera, a joint venture between Robinhood and SIG, went live in May and ranked fourth in June with $2.1 billion in trading volume. This wave of growth was mainly driven by sporting events, which accounted for 81% of the total volume of sports contracts on the Polymarket by June.
Hyperliquid's HYPE broke into the top ten market capitalization with newly launched ETFs, predictive market features, and the Coinbase listing agreement, and was the most notable exception among altcoins in the second quarter.
A new player has emerged in the tokenized collectibles market. Collector Crypt replaced Courtyard as number one with a 317% increase in monthly trading volume (from 97 million in January to $406 million in June), with a market share of 62.8% in June. However, the report also points out that more than 98% of the trading volume of these platforms comes from the gummy card drawing mechanism, which is not the real liquidity of the secondary market.
What changed in July's rebound
CoinGecko's report covers the end of June, and the July market has already given a partial response.
Bitcoin rebounded about 9.8% in July, rebounding from falling below $58,000 at the beginning of the month to around $65,000, hitting a July high of $67,000. But this rebound is not exciting in historical context: nine August falls were recorded in the past 12 years, with a median return rate of -7.49%. The 2018 script is the most commonly used analogy. July of that year also rebounded 21.3% after a sharp decline, then fell 9.4% in August, then fell another 6% in September, and completely crashed in November.
The current price of Bitcoin is around $64,000, retreating about 49% from its all-time high of $126,000 in October 2025, and needs to double to return to its previous high. Whale Address had a net increase of about 270,000 BTC over the past month, but long-term holders' holdings have slowed by 47%. ETF funds have yet to return on a large scale.
Overall, the crypto market is experiencing an orderly capital retreat. There is no panic crash, only a slow decline. Where the tide recedes until it stops depends on two things: when the Federal Reserve will let go, and whether the industry can find a real source of revenue other than speculation before the next cycle arrives.
Twitter:https://twitter.com/BitpushNewsCN
Compare the TG exchange group:https://t.me/BitPushCommunity
Compare TG subscriptions:https://t.me/bitpush
