
股市 · 3793

The net profit of six foreign brokerage firms in Korea surged 214% year on year in Q2, with J.P. Morgan Chase leading the net profit of about US$148 million

Comparatively, as the Korean stock market rose sharply in the second quarter and KOSPI surpassed 9,000 points for the first time, six foreign securities companies, including J.P. Morgan Chase, Goldman Sachs, Merrill Lynch, UBS, Morgan Stanley, and Citigroup Global Markets, achieved a total net profit of 6305 billion won (approximately US$455 million) in South Korea in the second quarter, up 213.8% year on year and 133.3% month-on-month. Among them, J.P. Morgan had the highest net profit of 204.5 billion won (approximately US$148 million), with only 87 employees in Korea as of the end of June; Goldman Sachs's net profit for the second quarter was 137.1 billion won (approximately US$98.9 million). The transaction volume of foreign investors in the Korean securities market reached 1851.9 trillion won (about 1.34 trillion US dollars) during the same period, an increase of 312% over the previous year. The sharp increase in trading activity is considered to be one of the main factors driving the growth in the performance of foreign securities businesses. (Econovill)

1m ago

The Korean stock market experienced from fervor to despair, and retail leveraged investors lost tens of billions of dollars

Comparative news, according to Reuters, the Korea Composite Stock Price Index (KOSPI) fell 30% from its June 19 high. The previous stock market frenzy driven by the AI boom and leveraged capital quickly turned pessimistic. The South Korean government originally planned to eliminate South Korea's discounts by introducing more investment tools and improving corporate governance, but sharp market fluctuations have made the effects of policies and investors' risk tolerance come under scrutiny. South Korea's regulators allowed the listing of single-stock leveraged ETFs on May 27. Investors only need to complete 1 hour of training and deposit at least 10 million won to participate. In the same period, Samsung Electronics and SK Hynix both reached $1 trillion in market capitalization, driving KOSPI to more than double the level in October last year and surpass 8,000 points. Retail investors borrowed heavily to chase the AI market, and KOSPI's financing balance increased by about 75% during the year, reaching a record 29.8 trillion won on June 24. As Samsung Electronics and SK Hynix together account for more than 53% of KOSPI's total market value, related leveraged products further amplify market fluctuations. At the beginning of July, the Korean Panic Index VKOSPI rose to 97.99, the highest level since statistics began in 2009. Citibank estimated on July 28 that retail investors lost $38.7 billion in leveraged ETFs. The market correction has also brought social pressure. A Seoul psychiatrist said that the number of stock investment-related patients he has received has risen from 7 to 8 patients per day last year to an average of 11 per day since June this year. Busan police also arrested a man in his 20s who allegedly stabbed a YouTuber, who is accused of blaming the other party for stock losses. Currently, the South Korean authorities have tightened restrictions on individual investment in leveraged ETFs. Analysts believe that excessive volatility may also affect South Korea's goal of being included in the MSCI developed markets index.

1m ago

The sharp decline in Korean stocks made it difficult to stop risk appetite, and retail investors switched to high-interest structured products

Comparative news, according to Kim Sook's report, an unprecedented stock market crash is driving retail investors in South Korea to switch to complex structured products. This group of risk-loving investors is still constantly looking for ways to improve returns. Equity Linked Securities (ELS), which have annualized interest rates of up to 40% to 50%, are once again popular with retail investors. In July, ELS sales rose to a three-year high, with mainly products linked to Samsung Electronics and SK Hynix. Meanwhile, regulators are working to curb retail fervent demand for single-stock leveraged open-ended index funds. This type of product is thought to have amplified market fluctuations during the 22% drop in the benchmark Korea Composite Stock Price Index last month. This shows that one of the largest market crashes in recent memory did little to weaken retail investors' risk appetite; it only changed the types of products they were chasing. The recent market correction seems to have created an attractive entry point for ELS products. This type of product can provide investors with coupon interest as long as the linked stock or index remains within a pre-set range. However, once the market falls sharply, such products may also face huge downside risks.

1m ago

Next week's macro outlook: US and Iran sanctions, Jackson Hole, PCE, and Nvidia's earnings report are coming in four major variables. The gold sword points to $4,700

Comparing news, the global market will face multiple risk events next week. The escalation of US and Iran sanctions, Federal Reserve Chairman Walsh's debut at the Jackson Hole World Central Bank Annual Meeting, the release of PCE inflation data in the US for July, and the disclosure of Nvidia's earnings report may become core variables affecting risk asset trends. This week, the sharp rise in US long-term bond yields raised market concerns. After the Treasury expanded the scale of long-term US bond repurchases, the pressure on the bond market eased somewhat, but investors are still concerned about the US fiscal deficit, inflation, and developments in the Middle East. Driven by US debt sustainability concerns, the weakening dollar, and the Treasury Department's expansion of the US bond repurchase program, spot gold surpassed 4,600 US dollars/ounce this week, rising for the third consecutive week, and hit a high of around $4,632 on Friday. Analysts believe that if gold effectively breaks through $4,600, the next target may be at $4680 or even $4,700. Next week, the US-Iran relationship will be the primary focus of the market. US Treasury Secretary Bessent said that the Trump administration will announce new sanctions against Iran on Monday. Trump previously warned that any country providing support to Iran could face economic consequences. Meanwhile, transportation activities in the Strait of Hormuz continue to be blocked, and energy supply risks are driving crude oil to rise continuously. On the Federal Reserve side, the Jackson Hole Global Central Bank Annual Meeting will be held from August 27th to 29th, and Federal Reserve Chairman Walsh will deliver his first speech on August 28. The market is concerned about whether it will release future interest rate path signals and whether it can ease recent pressure on the US bond market. Currently, the market expects that the probability that the Federal Reserve will cut interest rates in September has declined, and traders will focus on Walsh's statement on the 2% inflation target, long-term interest rate, and monetary policy framework. In terms of economic data, the US core PCE price index for July will be released next week. This is the inflation indicator that the Federal Reserve is focusing on. The market expects core PCE to rise 0.2% month-on-month. If the data is higher than expected, it may weaken expectations of interest rate cuts and put pressure on gold; if it falls short, it may further drive the rise of precious metals. In addition, revised US second-quarter GDP values, durable goods orders, consumer confidence index, and revised non-farm payroll benchmark data will also be released one after another next week. On the corporate side, Nvidia's (NVDA) earnings report will be the focus of the US stock market. Technology stocks have recently been under pressure. The Nasdaq index fell about 2% this week, and the semiconductor sector fell by more than 4%. The market will focus on Nvidia's continued investment in AI infrastructure, the progress of Rubin chips, and the state of business in China. Analysts believe that if Nvidia's performance continues to strengthen AI growth expectations, it may become an important catalyst for the S&P 500 index to hit 8,000 points; if performance or guidance falls short of expectations, it may increase the pressure on technology stocks to adjust.

16h ago

Tom Lee: BitMine shares are 80% correlated with ETH, and ETH will outperform BTC in this cycle

In comparison, BitMine Chairman Tom Lee posted an article listing 17 large cap stocks (with a market capitalization of over $2 billion) that are highly relevant to cryptocurrencies for reference by stock investors seeking crypto exposure. Among them, BMNR had the highest correlation with ETH at 80%, followed by COIN (74%); MSTR had the highest correlation with BTC at 78%, followed by COIN (74%). Tom Lee said that ETH is expected to outperform BTC in this cycle, driven by tokenization and AI applications, and believes that this logic is far more important than the drivers for ETH to outperform cycles in the past.

1d ago

J.P. Morgan warns of the risk of a fall pullback in US stocks, the AI boom may repeat the 2000 tech bubble

Comparing news, JPMorgan (JPMorgan) warned that although the world's major stock indexes are still on an upward trend, the market may face the risk of a pullback in late summer to early fall. The bank said that recently the internal structure of the US stock market is deteriorating, capital has begun to shift to defensive assets, and investors' confidence in artificial intelligence (AI) related stocks has also weakened. Jason Hunter, a strategist at J.P. Morgan Chase, pointed out that the current AI trading boom is similar to the 1999-2000 tech stock bubble. The market's excessive concentration of positions in the technology sector may increase the risk of adjustment. Furthermore, the continued rise in US Treasury yields, geopolitical tension in the Middle East, and slowing consumer spending have also been identified by J.P. Morgan as potential sources of market pressure. J.P. Morgan believes that the current AI investment cycle still has potential for long-term growth, but market valuations, capital congestion, and investor expectations in the short term may put technology stocks at greater risk of volatility.

1d ago

Citibank: It is recommended to buy on dips to buy any US stock market correction before the midterm elections

Comparing news, the Citigroup report suggests investors continue to overstock stocks and increase their positions if the market falls before the US midterm elections. The bank believes that despite recent concerns about artificial intelligence, factors such as rising profit expectations, improved liquidity conditions, and limited warning signals provided support. Citi continues to be optimistic about the US stock market and believes that sector rotation may limit the downside. This article is sponsored by GENG, Build Your Fortune on GENG (https://geng.one)

1d agoburnking
If it's just tokenized assets and doesn't connect to DeFi, what's left of RWA?

If it's just tokenized assets and doesn't connect to DeFi, what's left of RWA?

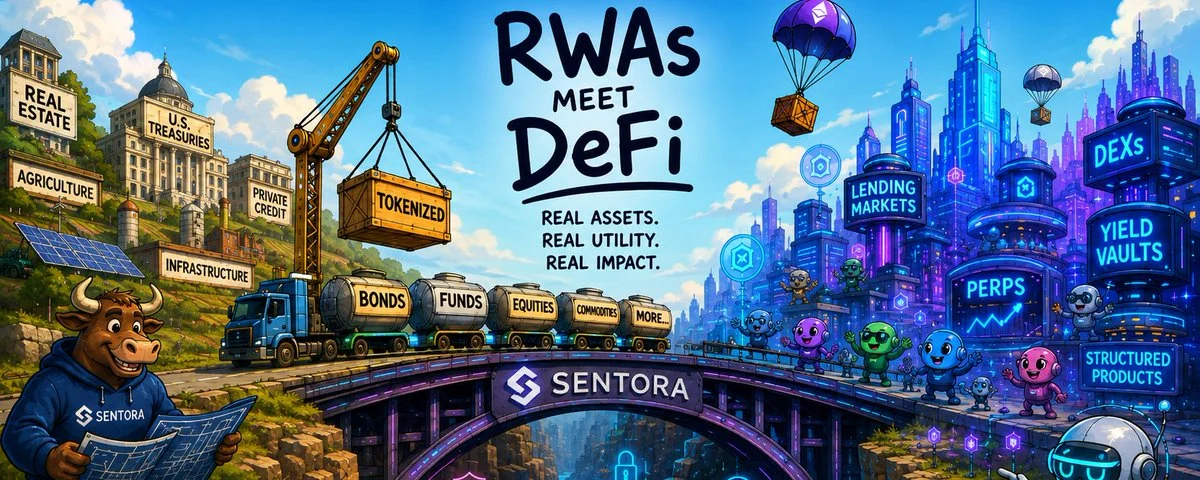
Author: Jesus Rodriguez, co-founder of Sentora Compiled by: Luffy, Foresight News Original title: Does RWA still make sense without DeFi? Discussions in the RWA industry often begin with a simple vision: take a treasury bill, fund share, stock, invoice, megawatt hour, or GPU for one hour, then mint a token representing it. Is it useful? It's really useful. But can it be called transformative? It's far from there. This is like putting a bar code on a container and claiming that a global trade problem has been solved. Barcodes make containers recognizable and machine-readable, but they don't create ports, cranes, customs, insurance, financing, shipping routes out of thin air, or bring in buyers from afar. A token is simply an addressable token of interest, and DeFi is a marketplace operating system. The question really worth discussing is not how many types of assets can go on the chain, but how many assets can complete valuation, financing, hedging, transaction monetization, and loss disposal in a stressful environment, and there is no need for offline meetings and coordination every time a transaction occurs. Tokenization completes the representation of equity; what DeFi brings is actual utility. Tokenization is just a bar code, and a similar scene has happened in the history of the supply chain finance market. The reason why mortgages can be scaled up is not as simple as turning a paper document into an electronic record. To actually achieve large-scale expansion, a complete set of operating mechanisms was created around this type of asset: credit review, post-loan services, securitization, credit rating, warehousing and financing, repurchases, hedging, clearing and settlement, and loss allocation rules. RWA also needed to go through the exact same evolutionary process. An asset that can be adapted to DeFi requires six levels: legally enforceable rights, reliable data sources, clear transfer and redemption rules, enforceable secondary market liquidity, collateral parameters that match actual behavior, and a credible settlement and loss disposal path. Most tokenization projects, on the other hand, tend to stop at the top five levels. There is a simple test that can be used to test the maturity of an asset. It only requires answering three questions: How much is this asset currently worth? Can the agreement complete withdrawal and monetization at this point? If the first two judgments are all wrong, who bears the loss? When smart contracts can definitively answer the above three questions, RWA can truly become a basic component of finance. Before that, it was mostly just a digital packaging shell. The deepest technical contradiction of RWA's quadruple time clock is that RWA runs under multiple sets of different time clocks at the same time. The blockchain can complete settlement in seconds and operate uninterrupted for 7 x 24 hours; oracles may update prices every hour or every day; underlying traditional exchanges are closed at night and on weekends; custodians follow bank working days; and the asset redemption process may take 1 day, 5 days, or even 30 days. If you use such a slow-paced RWA asset to support fast-maturing DeFi liabilities, such as stablecoin loans. This is the term shift, and it is also the core model that banks have relied on for hundreds of years: using short-term debt to fund long-term slow assets. This model has practical value, but the risk must be reasonably priced. Imagine a scenario: At 2 a.m. on Sunday, assets hit the liquidation threshold. Smart contracts can seize tokens immediately, but the underlying real-world market won't open until Monday, and the issuer's redemption business will not be processed until Tuesday. On-chain liquidation has been completed, and real-world asset disposal has only just begun. This creates a clearing gap. DeFi requires immediate withdrawal for monetization, but the real world does not allow it. The time difference between the two. This gap has counterintuitive consequences. Even treasury bonds with very low volatility are riskier than native crypto assets that are more volatile when used as collateral. The price of ETH fluctuates drastically, but it can be traded around the clock; the price of RWA assets appears to be stable, and it may only be up to a dozen hours without a new price tag. A flat price sometimes represents safety, and sometimes it's just a disguise of stale data. Liquidity is an exit channel, not TVL. The digital public also has common misunderstandings about liquidity. Liquidity is not equal to TVL, does not equal the existence of a trading pair, nor does it mean that the issuer promises to eventually redeem it according to net worth. Liquidity refers to the ability to convert a position into the settlement asset you need at an acceptable discount within the time window allowed by your debt. Take a crowded theater for example: the size of the hall cannot determine whether it is safe in the event of a fire; what really matters is the width of the exit channel. One copy of RWA to...

1d agoForesight News#DeFi #RWA

Chainlink CEO: The speed with which the US financial system goes up the chain will determine its global position

Comparing news, Chainlink co-founder and CEO Sergey Nazarov said at the first meeting of the US CFTC Innovation Advisory Committee that he thanked the CFTC and SEC for finally starting an efficient and constructive cooperation rather than publicly clashing with each other before. He believes that this in itself has significantly boosted the reputation and trust of the US financial market, and helped form a unified regulatory vision to prevent the 16 or 25 conflicting rules of the past from hindering innovation. Nazarov notes that regulatory fragmentation has taken a serious toll. Chainlink provides data, cross-chain and other infrastructure for thousands of applications, and supports most of the DeFi ecosystem. Over the past seven years, he has seen with his own eyes that hundreds of developers have chosen to leave the US due to uncertainty, no longer build high-quality apps in the US, and no longer serve American consumers. These innovators are no longer on the conference site, a huge loss for the US financial system and consumers. He emphasized that the next trend is clear: tokenizing equity will unlock significant on-chain value. The US stock market currently accounts for about 60% of the value and flow of the global equity market. If the global financial system speeds up the chain, the US must push the chain up at the same or even faster speed in order to maintain this dominant position. Otherwise, innovation and market advantage may be lost.

1d ago
Whoever sings down Anthropic may be disappointed

Whoever sings down Anthropic may be disappointed

Author: Alan Walker, Silicon Valley Original title: Is Anthropic's Growth Slowing Down? Source of controversy. Claude Code ARR tracking chart produced by TickerTrends. The latest data is $15.12 billion for the week of August 10, 2026, accounting for 21.9% of Anthropic's total ARR. Please note: This is an estimate from a third party agency and is not an official disclosure of Anthropic. The first section below explains how important this difference is. Alan Walker from Silicon Valley made an appointment for dinner in Hong Kong. After some hard work, he discovered that this picture had been retweeted more than 30 times, and the matching statement was similar — “Anthropic's growth has leveled off; 2 trillion dollars is a bubble.” Alan saved the image, zoomed it in, and looked at it again. The problem isn't in this picture. This picture is very well done, and the data is probably done seriously. The problem is that almost everyone who retweeted it was using it to answer a question it couldn't answer at all. 01 Let's first figure out who made this picture, there is a Claude icon in the upper left corner. The color scheme is Claude's familiar orange. At first glance, it looks like an official product. It's not. The author of this picture is TickerTrends and has his name written in the upper right corner. It is a third-party data tracking agency that uses various external signals (application data, payment panels, recruitment, channel caliber, etc.) to estimate the revenue of an unlisted company. The line in the picture is written very honestly: “tracked allocation” -- the percentage of allocations that have been tracked. Let's be clear: Anthropic has never publicly disclosed Claude Code's individual ARR numbers, not once. Every point on this curve has been estimated by an outsider. For example, this is like someone using “long queues at the entrance of a restaurant every day” to estimate its turnover and then draw a beautiful weekly curve. The length of the team does correlate with turnover, but in the middle there is turnover rate, customer unit price, takeout ratio, private room business — you see that the team is three short weeks, and the kitchen is probably being renovated in those three weeks. What is more important is the caliber itself. ARR's algorithm is “revenue for the most recent period times 12.” Enterprise software contracts are not executed evenly every day; they are signed batch by batch. Big orders signed at the end of a quarter will jump a week's curve by a large margin; if the next quarter's big orders aren't signed, the curve will go sideways. Weekly ARR tracking is extremely insensitive to this kind of blocky landing—it will paint the “pace of signing” as a “change in demand.” In a nutshell, what you have in your hand is an unofficial weekly map estimated by an outsider, with a very blunt caliber. Judging by the weight of the “bubble” under it is tantamount to using body temperature to measure blood pressure. 02 I hit myself in the face on this picture. I haven't seen anyone mention it, but it's the most interesting part of the whole thing. The picture shows two numbers: Claude Code is $15.12 billion, or 21.9% of Anthropic's total ARR. By dividing: calculate 15.12 billion ÷ 21.9% = about $69 billion. This is Anthropic's total ARR for the week ending August 10, implied by this image. The official caliber figures reported by Bloomberg, Reuters, and CNBC on August 17 were — $65 billion at the end of July. Clear: This chart, which is being used to prove “slowing growth,” its own implied total number of companies is 4 billion US dollars higher than the official figure ten days ago. Further 10 days until today, if the trend continues, more than 70 billion is a reasonable estimate (this sentence is an inference, not data). In one sentence, people who retweeted only read the number 151.2 and the height of the column, skipping the 21.9% next to it. And that 21.9% said: This company went a step further when everyone shouted “it's slowing down.” I only believe in the two numbers on the same picture that is beneficial to my opinion; this is not called analysis. 03 You are looking at the picture below. The money in the picture above has the upper and lower two pieces. Above is the absolute amount (how many billion dollars), and below is the percentage change (how much more than a percent increase from four weeks ago). The vast majority of people's reasoning is: below...

2d agoWendy#Anthropic #ARR #IPOs #MiniMax