


Whoever sings down Anthropic may be disappointed

Author: Alan Walker, Silicon Valley
Is Anthropic's growth slowing down
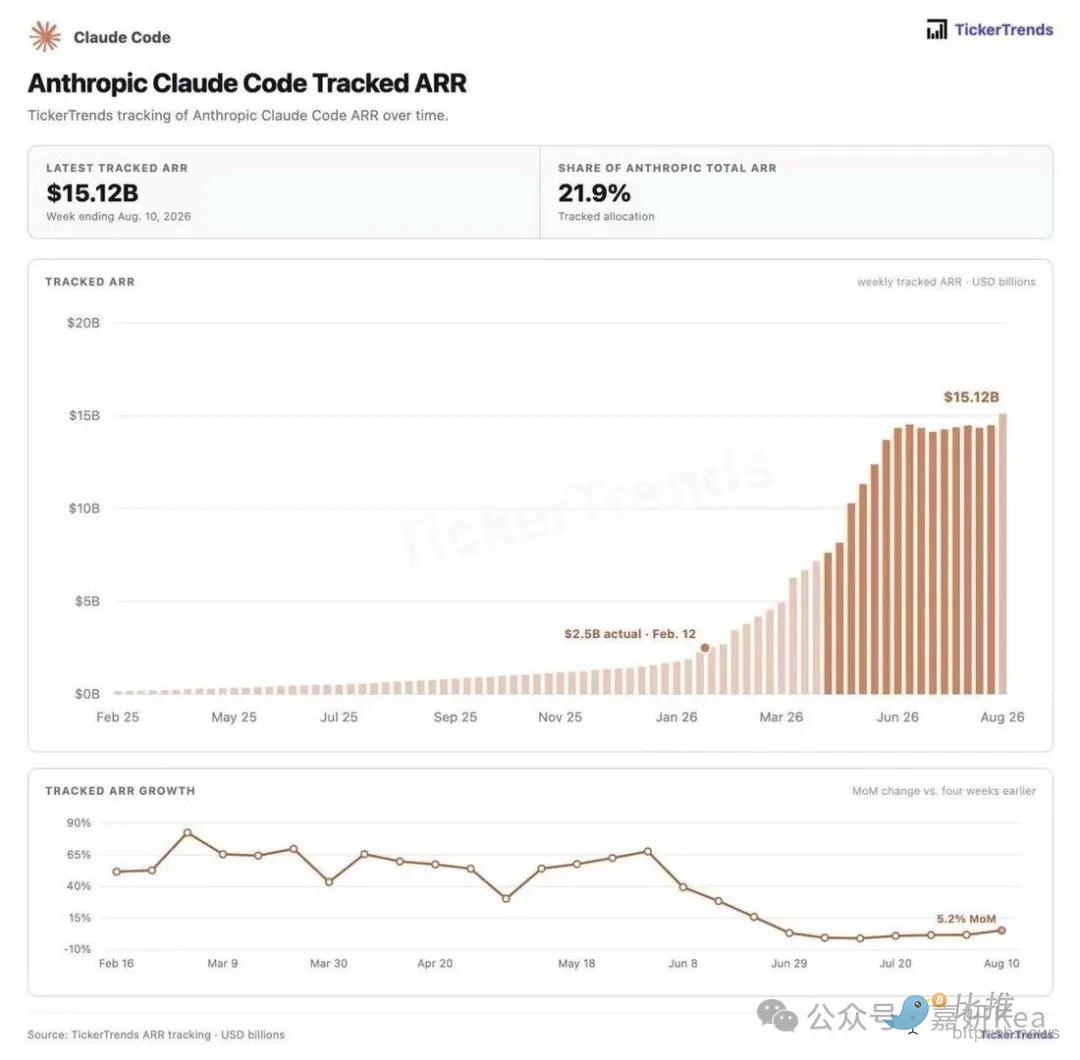
Alan Walker from Silicon Valley made an appointment for dinner in Hong Kong. After some hard work, he discovered that this picture had been retweeted more than 30 times, and the matching words were similar - “AnthropicGrowth leveled offNow, two trillion dollars is a bubble”.
Alan saved the image, zoomed it in, and looked at it again.
The problem isn't in this picture. This picture is very well done, and the data is probably done seriously. The problem is that almost everyone who retweeted it was using it to answer a question it couldn't answer at all.
01
Let's first figure out who made this picture
There is a Claude icon in the upper left corner. The color scheme is Claude's familiar orange. At first glance, it looks like an official product.
It's not.
The author of this picture isTickerTrends, My name is written in the upper right corner. It's a familyThird-party data tracking agenciesIt relies on various external signals (application data, payment panels, recruitment, channel caliber, etc.) to estimate the revenue of an unlisted company. The line in the picture is written very honestly: “tracked allocation” -- the percentage of allocation that has been tracked.
Let's be clear: Anthropic has never publicly disclosed Claude Code's individual ARR numbers, not once. Every point on this curve isEvaluated by outsiders。
Take an example
It's like someone using “how many long lines are in front of a restaurant every day” to estimate its turnover and then draw a beautiful weekly curve. The length of the team does correlate with turnover, but in the middle there is turnover rate, customer unit price, takeout ratio, private room business — you see that the team is three short weeks, and the kitchen is probably being renovated in those three weeks.
What is more important is the caliber itself. ARR's algorithm is”Earnings for the most recent period × 12”. Enterprise software contracts are not executed evenly every day; they are signed batch by batch. Big orders signed at the end of a quarter will jump a week's curve by a large margin; if the next quarter's big orders aren't signed, the curve will go sideways. Weekly ARR tracking is extremely insensitive to this kind of massive landing—it will”The pace of signing” Draw”Changes in demand”.
Interpretation in one sentence
What you have in your hand is an unofficial weekly chart estimated by an outsider, with a very blunt caliber. Judging by the weight of the “bubble” under it is tantamount to using body temperature to measure blood pressure.
02
This picture just punches myself in the face
Next, I haven't seen anyone mention this, but it's the most interesting part of the whole thing.
The picture says two numbers: Claude Code is$151.2 billion, accounting for Anthropic's total ARR21.9%。
Do a division:
Do the math
15.12 billion ÷ 21.9% = approximately $69 billion
This is Anthropic's general ARR for the week ending August 10th, implied by this image itself.
And the official caliber numbers reported by Bloomberg, Reuters, and CNBC on August 17 were — end of July$650 billion。
Clear: This chart, which is being used to prove “slowing growth,” its own implied total number of companies is 4 billion US dollars higher than the official figure ten days ago.
Push back another ten days until today. If the trend continues,Over 70 billionIt's a reasonable estimate (this sentence is an inference, not data).
Interpretation in one sentence
The retweet only read the number 151.2 and the height of the column, skipping the 21.9% next to it. And that 21.9% said: This company went a step further when everyone shouted “it's slowing down.” I only believe in the two numbers on the same picture that is beneficial to my opinion; this is not called analysis.
03
You're looking at the picture below. The money is in the picture above
That picture has two blocks above and below. Above is the absolute amount (how many billion dollars), and below is the percentage change (how much more than a percent increase from four weeks ago).
The vast majority of people's reasoning is that they saw 85% drop to 5.2% on the picture below, and “it collapsed,” then press this conclusion back to the picture above and say, “Look, the columns are all the same height.”
Count the numbers first. 5.2% × $15.12 billion = additional annualized revenue of approximately $750 million in one month. However, in the 85% month of March 2025, the base figure was less than 100 million US dollars — in the “outbreak” month, the actual increase was only in today's “lackluster” monthtenthsleft and right.
Take an example
Your son grew 20 cm a year when he was 3 years old and 3 cm a year old when he was 16 years old. The growth rate dropped 85%. Would you say “there's a problem with this kid's development”?
Percentages are fractions, and the denominator keeps getting bigger. An 85% increase of 100 yuan was 85 yuan, and a 5.2% increase of 15,120 yuan was 786 yuan. The latter is more than nine times the former. The “collapse” you see in the picture below was “nine times more profitable” in terms of money.
But Alan wants to be complete; otherwise, he's just kidding:Definitely newIndeed, from the peakRetreatThat's it.
In April and May, Claude Code rushed from 5 billion to 13.5 billion, with an average monthly increase of 4 billion; by July, there was only 300 million left. A decline of more than five times cannot be fooled by “you misread the percentages”.
So the real question isn't “is there any deceleration” — yes. There are really two things to ask:Why slow down?And why is it crooked again?
Please take another look at the far right of the image. The last pillar jumped up, and the line below also started2%It's back5.2%。A curve that is picking up at the right end was read as leveling off.
04
After three weeks of leveling off, the model went offline
If you take out the calendar and check it right, the answer is on the face; it's not mysterious at all.
On June 9, Anthropic made Mythos-level models publicly available and called Fable 5 and Mythos 5. On June 12, in order to comply with the US Department of Commerce'sexport control order, both models are offline. The Ministry of Commerce lifted the control on June 30 and resumed on July 1.
That so-called “”Platform period“, I just got stuck in this hole for three weeks.
What's more fundamental than these three weeksproduction capacity. Anthropic publicly acknowledged in April that demand was putting pressure on infrastructure and impacting reliability and performance during peak periods. And the vast majority of the computing power agreements it has signed with Amazon, Google, Nvidia, and Microsoft will arriveEnd of 2026或 Early 2027It just went online.
This section is the point
A revenue curve with the upper limit of production capacity leveling off means “everything that can be sold has been sold out”, not “no one has bought it.”
These two things look exactly the same on the picture. In terms of valuation, one is the ceiling and the other is the launch pad.
Take an example
There were only 20 tables in a hot pot restaurant. Every day they turned the tables until they closed, and the turnover went flat for three months. Can you say “this store is no longer popular”? Its turnover is locked in by the number of tables. When the table next door comes down and 50 tables are added, the turnover will immediately jump one level. How do you tell the difference between “no one came” and “couldn't sit down”? Look at three things: whether it's reduced in price (no), whether there are any queues or speed limits (yes), and whether it fills up immediately after adding a table (this is exactly what the August pillar that jumped up is saying).
05
Percentage of people who can talk: 17% increased to 22%
If Claude Code actually stalls, its share of the company's revenue should drop. The opposite is true.
November 2025 -Claude Code 1 billion | The company's total ARR is about 7-90 billion | accounting for about 12%
February 2026 -Claude Code 2.5 billion | The company's total ARR is about 14 billion | accounting for about 18%
May 2026- Claude Code ~ 8 billion | Total company ARR 47 billion | accounting for about 17%
August 10, 2026 - Claude Code 15.12 billion | The company's total ARR is approximately 69 billion | accounting for 21.9%
In what is known as”Platform period“In that window, Claude Code's share of the company's revenue increased from 17% to 22%. And in the same window, the total number of companies increased by about$180 billion。
Interpretation in one sentence
Not only was Claude Code not left behind, it also outperformed the average speed of a company that was 7.2 times older in seven months. (Of these, 8 billion in May was estimated from a single source. The total number of companies for February and November was estimated by me according to public nodes. See verification instructions at the end of the article. (However, the 17% and 21.9% denominators at both ends are relatively hard, and the conclusion does not depend on the accuracy of the numbers in the middle.)
06
Compared to the internet? The direction is completely reversed
Some people in the group said, “Internet users weren't that slow back then.” There are three mistakes in this sentence; they all go in the opposite direction.
First, the speed ratio is reversed
There were around 16 million internet users worldwide in 1995 and 360 million in 2000. Twenty-three times in five years, annualized about 86%. Claude Code isSix times in six months. Put it on the same ruler, it's more than an order of magnitude faster than the internet became popular.
Another harsher reference: Salesforce spent about 20 years generating $30 billion in annual revenue. Anthropic started with the first dollar in less than three years.
Second, the shape of the S curve is reversed
The percentage growth rate of internet user growth declined from day one. From 1 million subscribers in 1994 to 23 million in 2000, AOL's monthly growth rate has been declining, while net monthly growth has continued to rise. All S curves look like this:Percentage decrease, absolute value increase。
Third, the dimensions are wrong
The number of users is a variable. Revenue isSeats × usage × unit priceThe three variables are multiplied.
Take an example
One company bought 500 Claude Code seats, and next year they probably won't add a new seat — but every engineer went from running 2 agents a day to running 20, and usage increased tenfold; when added to the more expensive model tier, the unit price increased by one level. The number of seats has not moved at all, and revenue has increased more than ten times. There is no such path in the user curve; there are two paths in the revenue curve.
07
What you can't see in the picture: it's actually getting stronger
Anthropic hasn't just been “not that bad” this half year. It actually got stronger everywhere where it couldn't be taken in this picture at all.
1. Coming out of the “money burning” narrative
Q2 After adjustmentOperating profit is positive. In cutting-edge model labs, this is rare. The core doubt about AI companies in the past two years was “revenue was bought with money, and the unit economy was not established”. A positive operating profit figure reverses the burden of proof on the skeptical party. Moreover, this was done in half a year when computing power was tight and the most expensive.
2. Stop standing on one leg
Claude Code accounts for only 22%, and another 78%APIs and enterprise business. The market refers to Anthropic as “the company that makes programming tools,” but three-quarters of its revenue doesn't come from that tool. This means that even if one day competition among programming agents cuts Claude Code's share in half, the company won't collapse. However, today's pricing in the market is largely still tied to the “programming” story.
3. Customers are moving forward
Annual expensesOver $1 millionCustomers, from a dozen two years ago to more than 500, toMore than 1000 houses; Annual costOver $10 millionThe number of customers increased by about a year7 times. Major customers don't rely on sales to renew their fees, and they can't be pulled out once embedded in a workflow. This is a net revenue retention machine, and it is also the root reason why such companies can sustain high multiples even after the growth rate naturally declines.
4. Relative position changed
Over the same period of time: OpenAI doubled from about 20 billion to about 40 billion; Anthropic from 9 billion to 65 billion, 7.2 times. The two companies may have different caliber, but there is no disagreement about the direction of the gap.
08
Where is the next wave and when will it come
The following is Alan's judgment and is not a company disclosure. Four points, with time window.
Tap 1 | Computing power online — Q4 2026 to Q1 2027
This is the most straightforward and computable one. If the June and July platform is indeed due to production capacity, thenProduction capacity launchedIt's the mechanical unlocking of revenue: multi-gigawatt Amazon deployments, Google and Broadcom's TPU production capacity, and the computing power deal with xAI/SpaceX all point to this window. The observation method is rudimentary but effective: see if the speed limit has been relaxed, and whether the new-tier models are no longer queuing up. Relaxation on the product side will tell you the answer two months earlier than any financial report.
Point 2 | Moving out of the developer — Starting in the second half of 2026, volume in 2027
There are approximately 30 million professional developers worldwide. Knowledge workers are counted in billions. There are two orders of magnitude apart in the middle. Claude Code completed a proof question:agentThere are really people willing to pay for this stuff, and they are willing to pay a lot. Next, the @Claude set in Cowork, Excel, PowerPoint, Word, Outlook, Chrome, and Slack sells this verified willingness to pay to anyone who doesn't write code. This curve must have a slower slope than Claude Code — adoption by non-developers is slower and the workflow is more fragmented. But its ceiling isn't on the same floor. This is also the only serious answer to “what to do if the developer penetrates to the top”.
Point 3 | Mythos tier pricing — the timing is yet to be determined, but it must be a step
presentlyMythos PreviewOpen to only a few trusted agencies (Project Glasswing), Fable 5 is a public version with safety measures added. When this tier is actually used on a large scale, each customer's revenue jumps one level because it doesn't sell the same thing. This level of schedule has already been interrupted once by export controls (that is, the three weeks of June), so it is alsoPolicy risksOne of the most concentrated points.
Point 4 | The listing itself — September-October 2026
A prospectus was confidentially submitted to the SEC in June, and Morgan Stanley, Goldman Sachs, and J.P. Morgan Chase are underwriting. The listing is not a revenue event; it isCapital eventsHowever, its revenue transmission chain is extremely short: the money raised is converted into computational power, and computing power is exchanged for revenue. Also, Anthropic has an opportunity to get ahead of OpenAI — in an industry where computing power is production capacity, get it firstBig capital poolIt is a pioneer that can be compounded.
09
Is $2 trillion expensive? Let's take a look at Hong Kong first
This is the section in full I want people to read the most.
If you want to judge whether 2 trillion is expensive or not, you can't compare yourself to yourself; you have to findtaxon. And the best of its kind isn't NASDAQ — it's in Hong Kong.
January 8 and 9, 2026,Intellectual spectrum(02513.HK) andMiniMax(00100.HK) rang the bell on the Hong Kong Stock Exchange for two consecutive days and became one of the world's first publicly traded big model companies. For the first time, they let the market see what price the secondary market is willing to pay for a pure model company.
Smart Spectrum 02513.HKARR of approximately US$1 billion (July 2026) | Market capitalization of approximately HK$731.2 billion = US$93.8 billion (July 10) |about 94×2025 revenue of RMB 724 million, net loss of RMB 4.718 billion
MiniMax 00100.HKARR of approximately US$300 million (annualized in 2026) | Market capitalization of approximately HK$84.2 billion = US$10.8 billion (July 10) |about 36x2025 revenue of $79 million, adjusted net loss of $251 million
Anthropic if you press 2 trillionARR approximately $69 billion (August 10) | $2 trillion (market target) |about 29×Q2 Adjusted operating profit is positive
Connect these three lines to see
The Hong Kong market is willing to give about 94 times ARR to a company with an ARR of 1 billion US dollars and an annual loss of 4.7 billion yuan. Using the same ruler, Anthropic's 2 trillion is only about 29 times — while its ARR is 69 times that of the former, the growth rate is not slow, and it's already making money.
Either Hong Kong is crazy, or $2 trillion isn't expensive. You must choose one of these two conclusions.
Moreover, the number of intellects is not a wild path. Its market capitalization reached HK$691.5 billion in May 2026, then reached the HK$8800-900 billion range in June, and the Hang Seng Technology Index included it in May. According to its MaaS ARR of 1.7 billion yuan at the end of March, the market sales rate once reached 544 times; even using the 2026 revenue estimates of 7 billion yuan from Goldman Sachs and Morgan Stanley, it was still more than 130 times.
Interpretation in one sentence
People who take “the multiple is too high” to question 2 trillion dollars will find themselves questioning the wrong target if they take a look at the price of Hong Kong stocks being traded on the same track. In the current market sentiment, 2 trillion is equal to 69 billion ARR, which is the most of these threeconservedOne of them.
Let's expand on Anthropic's own caliber to see it more clearly:
Series H pricing (May 2026) 965 billion divided by 47 billion =20.5×
2 trillion ÷ current ARR (implied on chart) 200 billion ÷ 69 billion =29.0×
2 trillion ÷ ARR at the end of the year (FT estimates from investors 100 to 120 billion) 20 billion divided by 110 billion =18.2×
$2 trillion ÷ 2028 revenue ($1900—200 billion from the company to investors) $200 billion ÷ $1950 billion =10.3×
Two trillion isn't repriced at once; it's the same multiple times a larger base. The May private placement round has already been given20.5 times. If ARR falls within investors' expectations by the end of the year, $2 trillion would be cheaper than the May round.
So to prove the bubble, it is necessary to argue that “the 20 to 30 times ARR multiplier itself is wrong” rather than “growth has stopped” — the latter has been directly rejected by the data. The difficulty of these two matters varies greatly: the former involves gross profit margin, retention, and the competitive landscape; the latter only requires reading the wrong picture. Most people chose the latter.
Methodological Reminder
Don't apply current multiples to forward income.” Today's ARR is 29 times, and the ARR doubles next year, so it's worth 4 trillion” — this is counting the same increase twice.multiples 和 growthsOnly one of them is a variable. The table above is divided into four lines so that the numerator denominators of each line stand at the same point in time.
But Hong Kong also gave a warning · Four months of MiniMax
MiniMax went public on January 9 at an issue price of HK$165 and closed up 109% on the first day. It reached a high of HK$1,330 in March, and at one point the market capitalization surpassed HK$410 billion. By July 10, the market capitalization was HK$84.2 billion — down about 80% from its peak. It took four months. The turning point wasBan lifted. Once the scarcity premium becomes fundamental pricing,Multiple shrinkageIt will be faster than anyone expected.
This doesn't mean anything to Anthropic “so it will also drop 80%” — the difference in revenue size between the two is 200 times, and the profit status is completely different. The real meaning is: after listing, the story gave way tostatement. In the September or October prospectus, gross profit margin, retention rate,Customer concentrationIt will be written in black and white for the first time. That's where pricing really starts.
10
4 things that should really make a noise
None of the questions that can change the conclusion are on that picture.
gross profit margin。This is the only weighty point of contention. Reasoned costs sit in the cost category. If 29 times revenue corresponds to 50% gross profit, it is actually 58 times gross profit, and the location is not cheap right away. The reference system already exists: Zhi Spectrum's comprehensive gross profit margin of 41.0% in 2025, MiniMax 25.4% (of which 69.4% on the enterprise side and only 4.7% on the consumer side). The traditional SaaS structure of 75% to 85% has not been achieved by anyone in the big model industry at present.
Revenue caliber。ARR is the most recent month multiplied by twelve. If it is tightened to a more conservative approach before listing, there will be a “contraction” on the books; this is not a deterioration in business. The real hard figure is recorded revenue: $16.23 billion for the first half of the year.
Customer concentration and retention。6How much of the 5 billion miles comes from the top 20 customers? It will be in the prospectus. The impact of this figure on valuation exceeds all curve fluctuations over the next six months.
Developer ceiling。15.12 billion ÷ 30 million developers = $500 per person per year. This penetration isn't low anymore. Further, we must rely on the unit price, usage, or “getting out of the developer” mentioned in section 8.
11
Write at the end
In September or October, the prospectus will replace all speculation with Audited figures. Gross profit margin, retention, concentration, true caliber — everything that is making noise in the crowd today will become a table that can be checked by then.
Until then, using a weekly curve estimated by a third party to determine the fate of a $65 billion ARR company was using the weakest evidence at hand to answer the most serious questions.
That picture clearly shows only one thing: Claude Code started in six months2.5 billionIt grows until151 billionMeanwhile, due to an export control order, the model went offline for three weeks.
The rest are all mind-reading at the height of the pillar.
The diner arrived. See the prospectus for September.
Verification instructions
I. Verified (multiple mainstream media, August 17-18, 2026)
· Anthropic ARR surpassed $65 billion at the end of July; $47 billion in May; approximately $9 billion at the end of 2025. Bloomberg debut, independently confirmed by Reuters, CNBC, Axios, and TechCrunch.
· Initial revenue for Q2 exceeded $11.5 billion, or $787 million in the same period last year; Q1 was 4.73 billion, up more than 140% month-on-month; Q2 adjusted operating profit was positive (documents seen by Bloomberg). OpenAI's ARR was around $40 billion, and about $20 billion (Bloomberg) at the beginning of the year.
· Investors expect $100-120 billion (FT) by the end of 2026; the company's 2028 revenue forecast for investors is $1900-200 billion (Reuters, August 14).
· The S-1 was confidentially submitted in June 2026, underwritten by Morgan Stanley, Goldman Sachs, and J.P. Morgan Chase, and is expected to go public in September or October. Series H was completed on May 28 at a valuation of $965 billion.
· Fable 5 and Mythos 5 went live on June 9, went offline on June 12 due to the Ministry of Commerce's export control order, the controls were lifted on June 30, and resumed on July 1.
· MiniMax was listed on the Hong Kong Stock Exchange on January 8, 2026, and MiniMax on January 9; Smart Spectrum's 2025 revenue was 724 million yuan (+131.9%), consolidated gross profit margin of 41.0%, net loss of 4.718 billion yuan, adjusted net loss of 3.182 billion yuan; MiniMax 2025 revenue of $79.38 million (+158.9%), gross profit margin of 25.4%, and adjusted net loss of US$250.9 million.
· MiniMax reached a high of around HK$1,330 in March, and its market capitalization once exceeded HK$410 billion; on July 10, the market capitalization was about HK$84.242 billion. Smart Spectrum's market capitalization on July 10 was HK$731.18 billion.
II. Single Source/Estimate/ Unverified
· The $15.12 billion and 21.9% share in the chart are from TickerTrends, a third-party estimate (“tracked allocation” on the page), not officially disclosed by Anthropic. Anthropic has never separately disclosed Claude Code's ARR.
· “Approximately 69 billion company total ARR” introduced by 15.12 billion ÷ 21.9% is an implied value under this third party's caliber and is not an official figure. “Probably over 70 billion today” is the author's inference.
· Claude Code is approximately 8 billion in May 2026, from a single second-hand statistics site; in the table, the company's total ARR for November 2025 and February 2026 is estimated based on public nodes, and is an undisclosed value.
· Zhi Spectrum ARR “Approximately US$1 billion (July 2026)” came from several Chinese media quoting people familiar with the matter, and Zhi Spectrum did not respond to confirmation. The public ARR caliber that can be verified by Smart Spectrum was RMB 1.7 billion for the MaaS platform at the end of March.
· MiniMax's “annualized revenue of about 300 million US dollars” comes from media extrapolation of its ARR exceeding $150 million in February 2026, undisclosed by the company.
· HKD/USD is converted at 7.8. The Hong Kong stock market value is the July 10 data. It fluctuates greatly, and the actual figures may be significantly different when readers read it.
· The target valuation of the $2 trillion IPO is a market expectation quoted by the media and is not publicly stated by the company.
· Customers spending more than 1 million dollars a year “more than 1,000 companies” and customers over 100,000 US dollars “7 times a year” came from previous public statements from Sacra and the company, without checking the latest time.
· The amount of the computing power transaction with xAI/ SpaceX comes from media reports, and there is no original announcement from both parties.
3. Historical References (Public Records)
· Global Internet users were around 16 million in 1995 and 360 million in 2000; AOL subscribers were around 1 million in 1994 and 23 million in 2000. There are differences between different source calibers.
· It took about 20 years for Salesforce to reach approximately $30 billion in annual revenue.
4. Author's Inference (Untrue)
· The main reason for the June-July platform period was capacity constraints and export control shutdowns rather than peak demand.
· The four “next wave” points and time windows are all inferences; the computing power window depends on the publicly reported launch time of the agreement, which is not promised by the company.
· The comparison “The multiple given by the Hong Kong market indicates that 2 trillion dollars is not expensive” assumes that the three companies are comparable. In fact, business structures, customer regions, regulatory environments, and liquidity discounts and premiums are all different. Cross-market multiplier comparisons can only be used as a reference level; they cannot be used as a basis for pricing.
· Gross margin is the only weighty point of contention. 29 times revenue corresponds to an estimate of 58 times gross profit. For illustrative purposes, Anthropic did not disclose gross profit margin.
· The penetration estimate of about $500/year per developer uses the median value of “about 30 million professional developers worldwide”. The caliber itself is controversial.
5. Important Reminder
· ARR and recorded revenue are two different things. ARR is an annualized extrapolation of recent earnings, which amplifies both good and bad months.
· This article does not constitute investment advice. Anthropic is not currently listed; the stock prices of the Hong Kong stock companies mentioned in the article fluctuate drastically, and historical performance is not indicative of the future.
Twitter:https://twitter.com/BitpushNewsCN
Compare the TG exchange group:https://t.me/BitPushCommunity
Compare TG subscriptions:https://t.me/bitpush
