


Bitcoin's market share fluctuated in 12 years, hiding the “evolutionary theory” of the crypto industry

Source: Web3 Practitioner
Original title: 12 Years of Bitcoin Market Share: Ecological Evolution History from Monopoly to Checks and Balances
In the evolution of the crypto market, Bitcoin's dominant position has been steady for eight years, and its current market share is in a dynamic balance around the 12-year average.
Back in the 12-year period from 2013 to 2025, Bitcoin's market share showed significant volatility, covering the range from an all-time low of 31.1% to an early high of 99.1%. Looking at the time distribution, the market share remained at 50.0% and above for about two-thirds of the trading days — which means that Bitcoin dominated the market for 8 years during this 12-year cycle, highlighting its fundamental position in the crypto ecosystem.
Looking at annual trends, Bitcoin's market share has gone through many rounds of adjustments: starting at a high of 93.3% in 2013, then falling to 44.6% in 2018; rebounding to 60.2% in 2019 and rising slightly to 62.7% in 2020; falling back to 47.6% in 2021 and falling further to 39.3% in 2022.
Since 2023, Bitcoin's market share has been rising steadily: the annual average in 2023 rose to 45.6%, climbed to 51.9% in 2024, and has reached 59.3% since 2025. This value is gradually converging to the central level of 62.5% per day over 12 years.It reflects a further strengthening of the market's consensus on its core values.
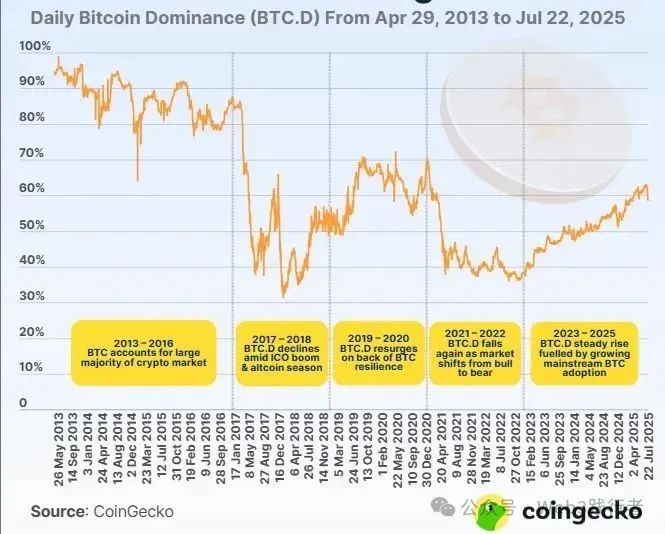
The fluctuating trajectory of Bitcoin's market share is not only a microcosm of the crypto market's evolution from a single asset pattern to a diverse ecosystem, but also reflects its resilience as a “crypto asset pricing anchor” — even in the cycle of alternating altcoins, its long-term dominance has not been shaken, and the current return to the mean highlights the sustainability of this structural advantage.
Key thresholds for Bitcoin market share and market evolution signals
Since February 2016, Bitcoin's market share has remained below 90%. Behind this inflection point is a structural shift in the market driven by the 2017 ICO boom and the first round of the altcoin bull market — the expansion of the number of mainstream altcoins and the rise in market capitalization, marking the mature transition of the crypto market from “Bitcoin single dominance” to “multi-asset symbiosis.”
The evolution of another key value is iconic: Bitcoin's market share continued to decline after hitting 70.7% on January 3, 2021, and has remained below 70% for a long time since then. This means that in the past 12 years, its average daily market share reached 70% or more for only one-third, reflecting a significant decline in market acceptance of “ultra-high dominance.” Currently, whether Bitcoin can break through the 70% threshold again has become an important indicator for observing the strength of market consensus.
Notable is the breakthrough on April 7, 2025: Bitcoin's market share rose to 60.5%, reaching the 60% mark for the first time in more than four years — the last time it crossed that threshold was on March 15, 2021 (60.6%). Judging from historical data, Bitcoin's market share has been below 60% for more than half of the past 12 years.This means that 60% has become the critical line for distinguishing “Bitcoin's relative strength” from the “active cycle of altcoins.”
The 12-year evolution of Bitcoin's market share
The yearly averages, minimums, and highs of Bitcoin's market share from 2013 to 2025 are as follows.
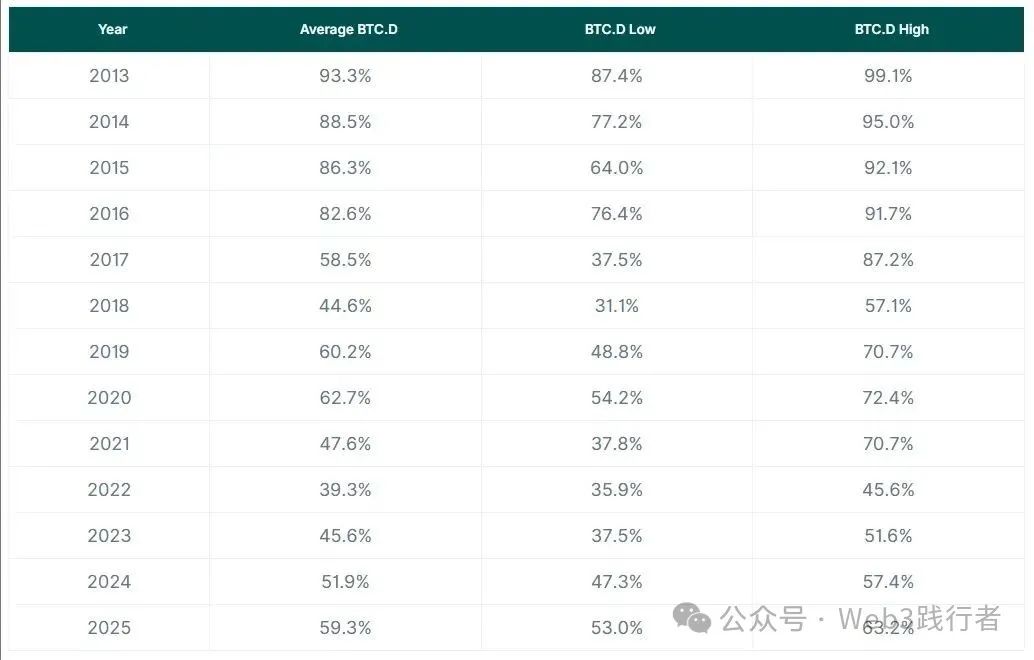
Absolute dominance period (2013-2016): monopoly position at 90% threshold
From 2013 to 2016, Bitcoin dominated the crypto market with an absolute advantage, and its average daily market share remained stable in the range of 82.6% to 93.3%. At this stage of the industry's enlightenment, even in the face of price pullbacks and regulatory shocks — such as the US's response to the leading exchange Mt. Gox's first major regulatory action, Bitcoin's market position remains unwavering, and even reached an all-time peak of 99.1% on May 29, 2013, almost synonymous with the entire crypto market.
Despite the overall monopoly trend, Bitcoin's market share experienced three significant fluctuations in the past four years, which epitomized the fragility and resilience of the early market:
On March 29, 2014, Mt. In the aftermath of the Gox collapse, Bitcoin's market share fell 10.9 percentage points in a single day, from 89.6% to 78.7%. This fluctuation stemmed from the fact that the total crypto market capitalization first soared during a panic sell-off and then corrected, reflecting the high sensitivity of the early market to a single event.
On January 15, 2015, a hacking attack on the Bitstamp exchange triggered a chain reaction. The price of Bitcoin plummeted from $221 the previous day to $172, driving market share to a sharp drop of 16.2 percentage points in a single day (from 80.2% to 64.0%), marking a panic sell-off at the bottom of the bear market.
The next day (January 16, 2015), market sentiment quickly recovered. Bitcoin's price recovered to $211, and the market share rebounded 16.7 percentage points to 80.7% at the same time, showing the characteristics of a “quick recovery after a sharp decline” in the early crypto market.
2017-2018: Bitcoin market share restructuring under the ICO wave and the rise of altcoins
From 2017 to 2018, the crypto market experienced a drastic transformation from “Bitcoin single-core dominance” to “full bloom of altcoins”. Bitcoin's market share continued to decline, falling below key thresholds of 80%, 70%, and even 50%, ushering in a historic restructuring of the ecological landscape.
In 2017, the ICO boom became the core engine driving the transformation. A large number of altcoins used blockchain concept financing to quickly divert market capital and attention. Bitcoin's market share fell all the way from 87.2% at the beginning of the year to 37.6% on June 19, down more than half from the beginning of the year; on May 16, it also fell below 50% (to 48.5%) for the first time, marking the complete end of the “Bitcoin monopoly market” era. Despite a brief rebound in the second half of the year, it hit a low of 37.5% for the whole year and closed at 38.9% at the end of the year, making it the most volatile year in 12 years.
The market logic was reversed in 2018. After experiencing wild speculation the previous year, the altcoin bubble gradually burst, and Bitcoin's market share showed an overall upward trend: it steadily climbed from 37.4% at the beginning of the year to 52% at the end of the year.
However, the year still left a historic low — on January 16, the price of Bitcoin plummeted from $14,412 to $11,724, and its market share bottomed out to 31.1% at the same time, setting the lowest record for the development of the crypto market so far, reflecting the collapse of the link between asset prices and market confidence amid bear market fears.
2019-2020: Expectations of halving and institutional entry drive Bitcoin back to dominance
From 2019 to 2020, Bitcoin's market share fluctuated and rebounded in the 48.8% to 72.5% range, marking a reassertion of its dominance in the crypto market. The formation of this trend is due to the resonance of multiple factors:
The core driving force comes from the market's strong expectations for Bitcoin's third halving in May 2020, and the deflationary nature of the halving mechanism reinforces its value storage narrative;
After the ICO bubble receded, capital began to focus on high-quality assets, and Bitcoin, as the “original anchor” of the crypto market, became the first safe haven choice;
Early institutional investors gradually incorporated Bitcoin into the “digital gold” asset allocation framework, further consolidating its central position;
In the “summer of DeFi” in 2020, Bitcoin, as the main deposit channel, assumed the role of a liquidity hub during the explosion of decentralized finance.
Driven by multiple factors, Bitcoin's market share escaped its low level in 2018 and has once again become a weather vane for market confidence.
2021-2022: Altcoin ecosystem expands and market share falls due to market turmoil
From 2021 to 2022, Bitcoin's market share continued to decline from 69.5% to 38.6%, with a cumulative decline of 30.9 percentage points, reflecting the double impact of the rise of the altcoin ecosystem and sharp market fluctuations.
This trend was particularly evident during the 2021 bull market cycle: although the price of Bitcoin climbed from $29,022 to a record high, closing at $47,192 at the end of the year, and rose 62.6% during the year, its market share fell from 69.5% at the beginning of the year to 38.2% at the end of the year. In stark contrast to this, the total market value of the entire crypto market soared from $776.4 billion to $2.3 trillion, an increase of 200.6%. Large-scale capital flows to cryptocurrencies, driving ecological diversification into a period of explosion.
In 2022, the market fluctuated downward amid the aftermath of the pandemic and systemic risks. Bitcoin's market share rose slightly from 37.9% at the beginning of the year to 38.6% at the end of the year, basically in sync with the 64.1% decline in the overall crypto market (Bitcoin price fell 64.2% during the year). Black swan events such as the collapse of the Terra-Luna algorithm stablecoin and the bankruptcy of the FTX exchange triggered a chain reaction. Investors turned to fiat currency for safe haven on a large scale. Bitcoin's attributes as a “risky asset” were amplified at this stage, and its market share fluctuated at a low level.
2023-2025: Bitcoin's transition to mainstream and the reshaping of market stability
From 2023 to 2025, Bitcoin's market share showed a steady upward trend, climbing from 38.4% at the beginning of 2023 to 58.5% since 2025. This trend is not only digital growth, but also a structural transformation of the crypto market — Bitcoin is rapidly integrating into the mainstream financial system from a “marginal asset”, and the breadth and depth of its value consensus has made a qualitative leap forward.
The core driving force behind this transformation stemmed from the combined effects of two milestone events: the approval of the US spot Bitcoin ETF in January 2024 opened the door to compliance allocation for traditional capital, and massive institutional funds were able to enter the market in an orderly manner; after the collapse of FTX, the global crypto regulatory framework gradually became clear, and the market changed from “barbaric growth” to “innovation under rules.” Bitcoin, as the most compliance-based crypto asset, naturally became the preferred target for institutional risk avoidance and layout. The two are jointly driving Bitcoin's transition from a “niche speculation tool” to a “mainstream asset class”. The rebound in market share is essentially a market vote on the “compliance+institutionalization” trend.
What is more noteworthy is that the volatility of Bitcoin's market share narrowed significantly during this period, and the single-day fluctuation range stabilized between -1.2 and +1.6 percentage points, showing unprecedented stability. Comparing historical data, it can be seen that the 2013-2016 (absolute dominance period) fluctuation range reached - 16.2 to +16.7 percentage points, reflecting early market fragility and speculation; in 2017-2022 (ecological differentiation period), fluctuations narrowed to - 8.8 to + 7.0 percentage points, but were still impacted by the altcoin cycle and black swan events; and the low fluctuation characteristics since 2023 indicate that Bitcoin's value anchoring effect has stabilized — changes in price and market share are no longer dependent on short-term sentiment or monopoly Instead, the event reflects more macro-capital allocation logic and long-term value consensus.
Behind this stability is the strengthening of Bitcoin's “financial infrastructure” attributes: it is both a ballast stone for the crypto market and a hub connecting traditional finance to the Web3 world. The steady recovery in market share and the narrowing of fluctuations have jointly drawn a clear conclusion: Bitcoin's mainstream process is irreversible, and its increasing weight in global asset allocation will continue to reshape the ecological pattern and pricing logic of the crypto market.
Final Chapter: Industry Implications Beyond Market Share
Twelve years of ups and downs have never been a “zero-sum game between Bitcoin and altcoins,” but a witness to the transformation of the crypto market from “technological experiments” to “financial infrastructure.” Fluctuations in Bitcoin's market share are not only an iteration of its own value narrative (from “peer-to-peer cash” to “digital gold” to “macro-hedging assets”), but also a deepening division of labor in the industry (symbiosis between underlying value anchors and application-level innovation). The current market share of 59.3% is close to the 12-year average of 62.5%. Perhaps it is the market's dynamic balance between “Bitcoin's core position” and “ecological diversification” — this balance will define the undertone of the next phase of the crypto market's development.
