


With a four-day increase over March, how fast is Wall Street's FOMO running this time?

Author: Fire
Original title: The FOMO market on Wall Street continues to heat up. How can the four-day rise exceed the three-month fluctuation?
After the market closed on August 4, Wall Street saw an acceleration that was hard to ignore. The S&P 500 index had a cumulative increase of 5.8% over the four trading days up to that day. According to Reuters, the options market also showed excessive readings, which have been rare for at least four years.
An increase in itself does not equal FOMO. What really makes this round of the market different is how fast the price is moving upward, and what kind of price code the options market shows for both upward and downward risks. Closing data included by FRED on August 4 also showed that the stock market continued to rise, and the VIX volatility index, which measures expected fluctuations, was also rising at the close. Optimism has not dampened the volatility.
Why do four days seem longer than three months
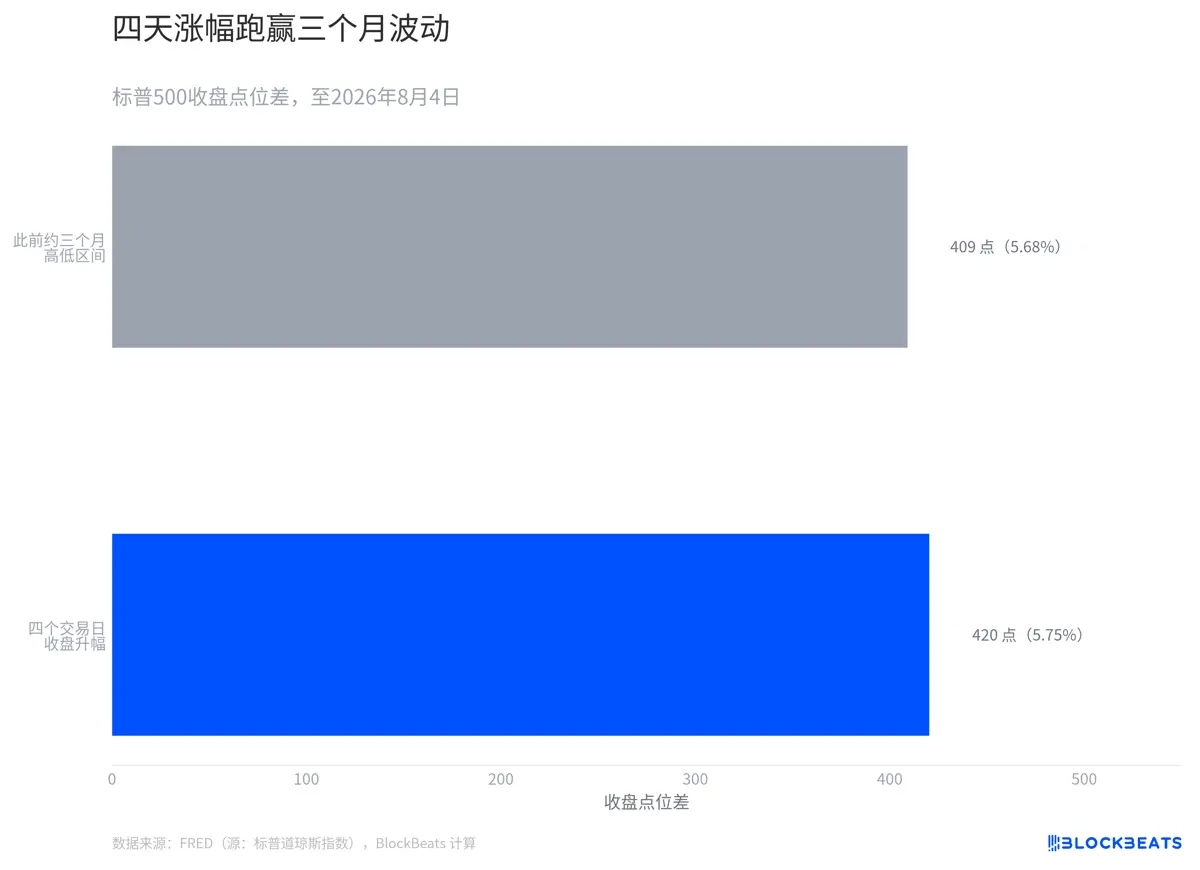
According to the daily closing data of the S&P Dow Jones Index included in FRED, the US Federal Reserve Bank of St. Louis economic database, the four-day upward movement has slightly exceeded the point difference between the highest close and the lowest close in the previous three months.
Putting the two changes side by side does not mean treating four-day earnings and the three-month high and low range as the same indicator. The former is direction, and the latter is scope. They fell on the same scale in order to clearly see a change in the pace of a transaction. The closing price fluctuation band formed over several months was crossed by a unidirectional movement of four trading days.
The price path itself doesn't prove the psychology of every participant. What it can show is that four consecutive trading days closed upward, which quickly raised the price of subsequent entry. Reuters summed up the phenomenon of traders chasing this round of gains as FOMO. The speed in the chart is exactly this statement that can be put back to the price series test part.
How rare is this in the last ten years
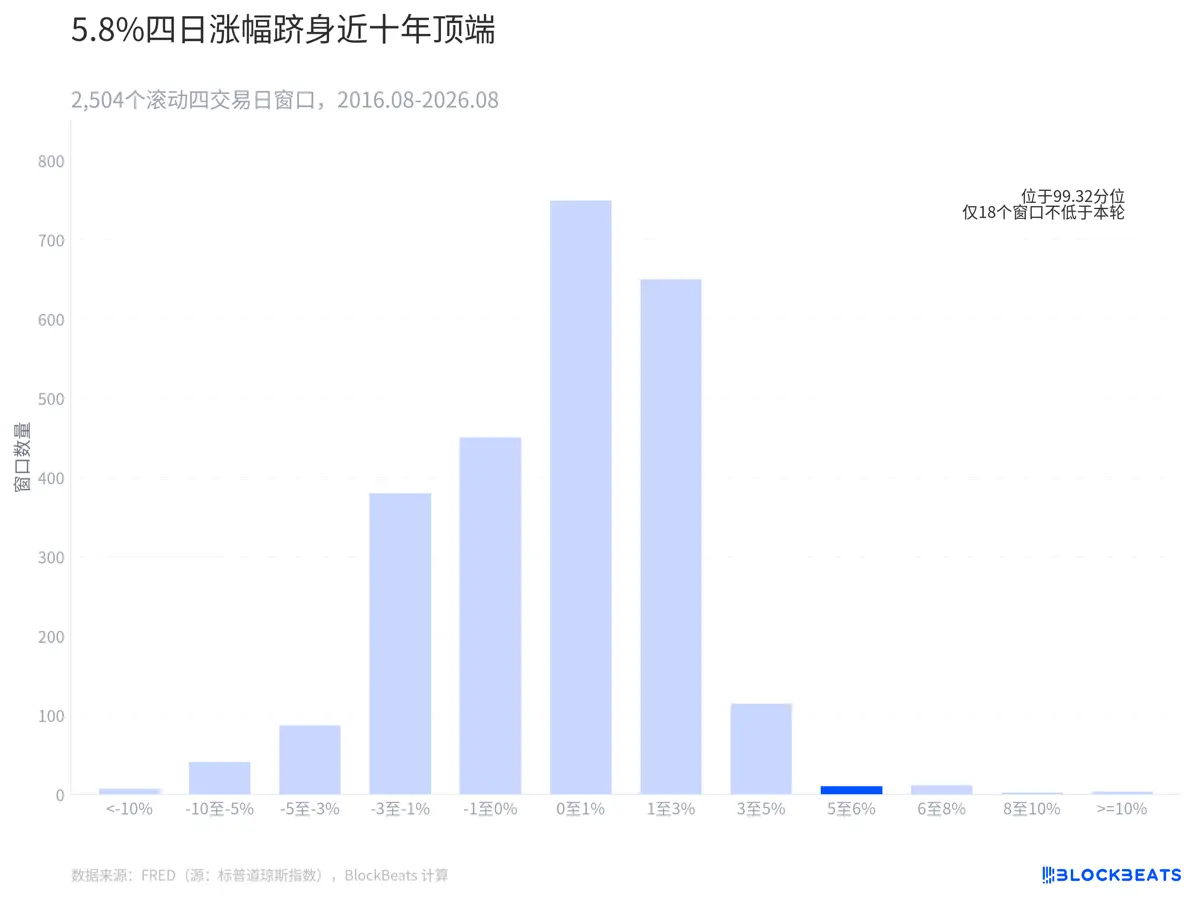
Using FRED's self-rolling calculation of the S&P 500 daily closing data for the past ten years, 2,504 four-day windows can be obtained. The 5.7458% increase in this round is in the 99.32nd quartile, and it has already fallen into the sparse area on the far right side of the chart.
Based on data included in FRED, only 18 windows had four-day gains of at least this level, including this round. This four-day range is uncommon.
How do bullishness and risk aversion occur at the same time in options
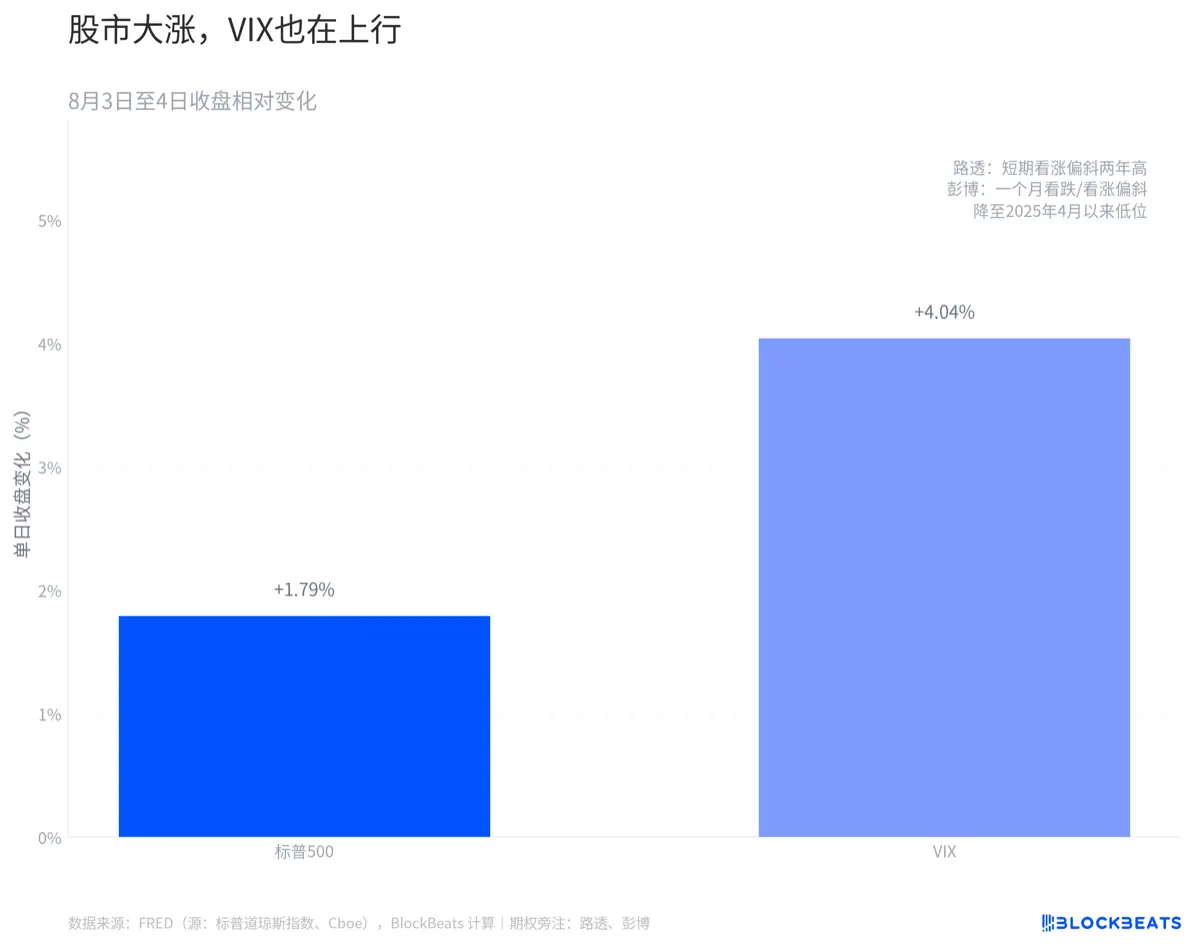
According to the closing data of the S&P Dow Jones Index and the Chicago Board Options Exchange Cboe included by FRED, the S&P 500 rose 1.79% and the VIX closed up 4.04%. The two prices are in the same direction, which at least indicates that at the end of the day's trading, the market did not completely lower the price of future fluctuations.
According to Reuters, the bullish bias for short-term options hit a two-year high. According to data from options data agency Trade Alert, the monthly average daily S&P 500 bullish/bearish ratio is 0.9, which is in the highest range in at least four years.
Twitter:https://twitter.com/BitpushNewsCN
Compare the TG exchange group:https://t.me/BitPushCommunity
Compare TG subscriptions:https://t.me/bitpush
