


Is “Cow Lai” really here? Bitcoin skyrocketed, and $2,743 billion bears were brutally liquidated

Source: PANews
Author: Nancy
Original title: Is “Cow Lai” really here? Bitcoin changed overnight, and bears faced the biggest liquidation day in history
Key points:
Bitcoin rebounded strongly on August 19, with an intraday increase of more than 7.4%. At one point, it was close to 70,000 US dollars.
It hit a new high since the beginning of June; Ethereum topped $2,300 at the same time.
Over the past 24 hours, the entire network closed out more than 2,986 billion US dollars, of which short liquidations reached 2,743 billion US dollars, setting a new record for short liquidation in a single day.
The recovery in the market is driven by multiple factors: the US Treasury expands the scale of long-term treasury bond repurchases to improve liquidity;
The SEC proposed that the new crypto asset issuance rules would exempt some registration requirements; Trump met with crypto business executives and made supporting remarks.
Urge Congress to pass the Clarity Act. Furthermore, the net inflow of Bitcoin spot ETFs has exceeded US$480 million in the past two days, causing large-scale short positions to close, causing a rolling effect.
On-chain data shows that spot demand is about to improve, with a median increase of about 18.1% over the next 60 days. However, Glassnode pointed out that high real interest rates are still a suppressing factor.
The market is still bottoming out, and the surrender is not yet completely over. VanEck believes that 8 of the 12 capitulation indicators have been triggered, but this is not a sign of bottoming out.
The potential cumulative window may be in September-November. Standard Chartered Bank expects Bitcoin to rise to 100,000 US dollars by the end of 2026.
An effective break above $65,500 may confirm the low of the cycle. CEO Strive believes that the long-term downward trend in the US dollar may bring the strongest macro tailwind to Bitcoin.
Overall, there are positive signs in the market, but continued strengthening still requires verification of demand, liquidity, and macro environment, and investors should maintain reasonable positions.
While the movie “Cow Lai” continues to be popular, the market's expectations for a “return to the bull market” are also constantly being ignited.
Coincidentally, the crypto market also suddenly ushered in a long-lost “bull attack”. Bitcoin's strong counterattack overnight led to a collective recovery of the market.
For the crypto market, which has been dormant for a long time, this surge not only means a breakthrough in price, but also a return to market volatility.
After the market heated up rapidly, market sentiment was instantly ignited, and coin industry players even ridiculed that “the native family is finally getting better.”
Meanwhile, this sudden strong rebound also simultaneously triggered a single-day liquidation wave of bears on an astonishing scale.
Bitcoin counterattacked strongly, and bears faced the biggest wave of liquidations in history
On the evening of August 19, Bitcoin broke out of a long-lost positive line and strongly broke through the consolidation range that had continued for several months.
According to CoinGecko data, Bitcoin suddenly experienced a strong rebound, with an intraday increase of more than 7.4%, once approaching 70,000 US dollars, a new high since the beginning of June.
Ethereum strengthened at the same time. At one point, the price broke through 2,300 US dollars, reaching a new high of nearly three months.
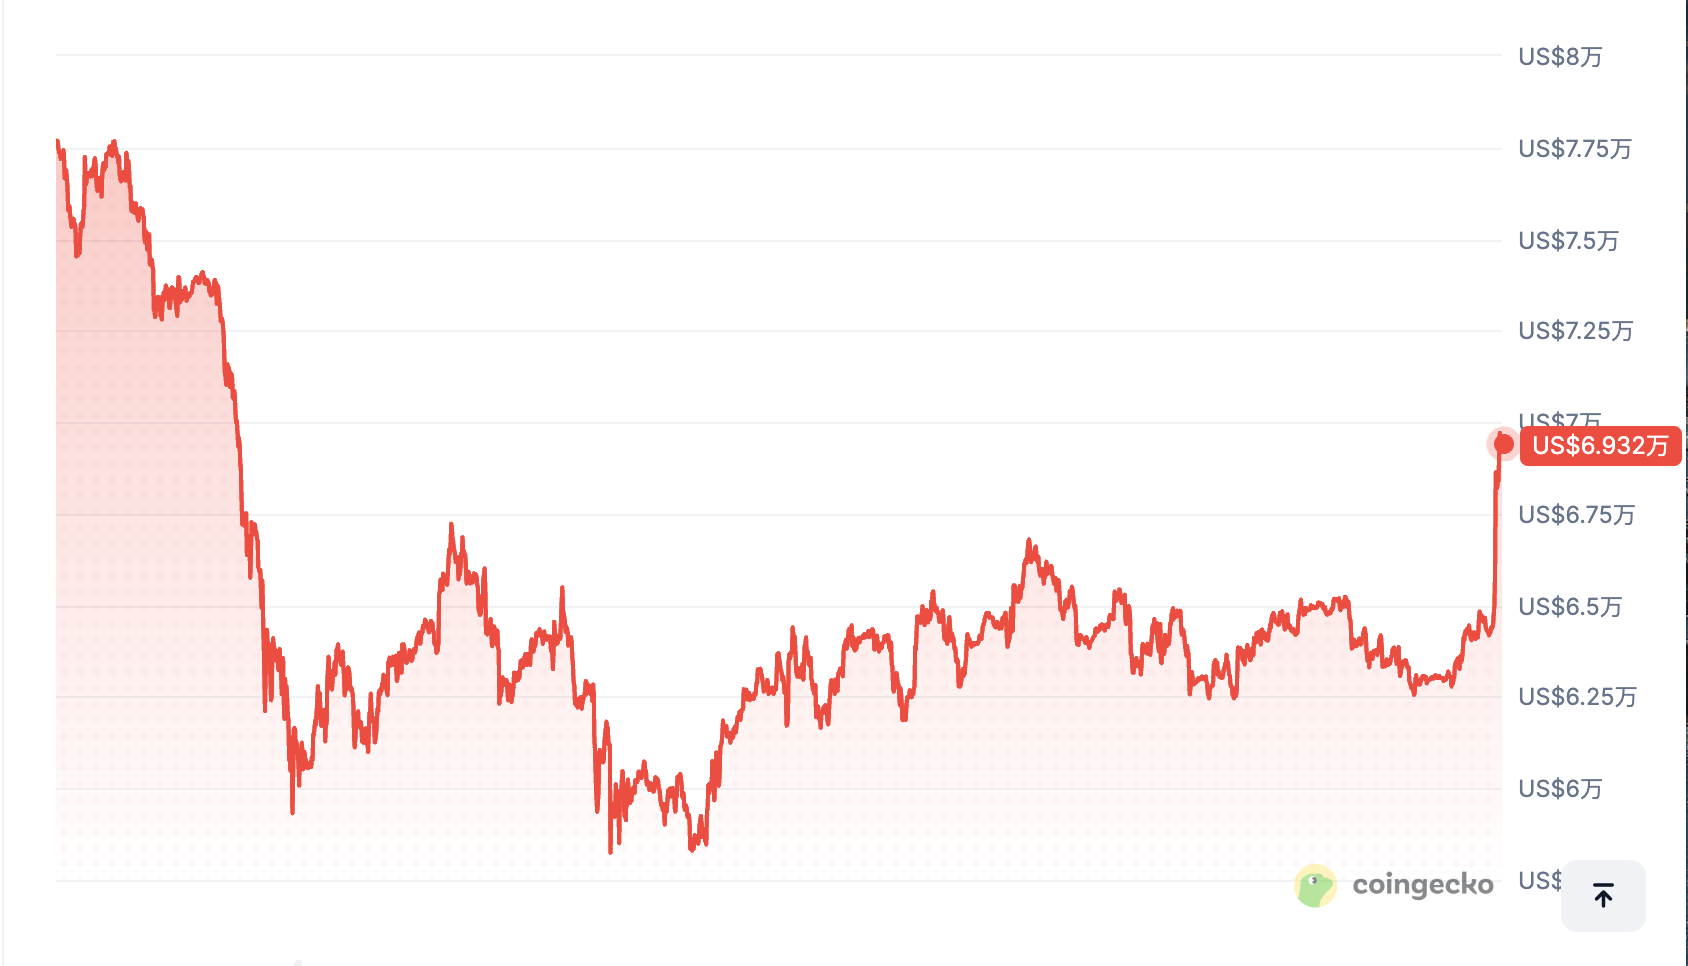
Over the past 24 hours, the total crypto market capitalization has risen by around 7.5%, recovering to around $2.46 trillion.
However, this sudden surge also turned into a large-scale bear slaughter.
According to CoinGlass data, the total amount of online liquidations in the past 24 hours has exceeded 2,986 billion US dollars, and more than 175,000 traders have been forced to close their positions.
Among them, the biggest single liquidation occurred in the BTC-USD contract on the Hyperliquid platform, which amounted to about US$48.8 million.
Judging from the historical scale, this liquidation wave has surpassed the single-day settlement record of about 2.23 billion US dollars during the “tariff shock” period in February 2025.
It is the eighth largest liquidation event in crypto history.
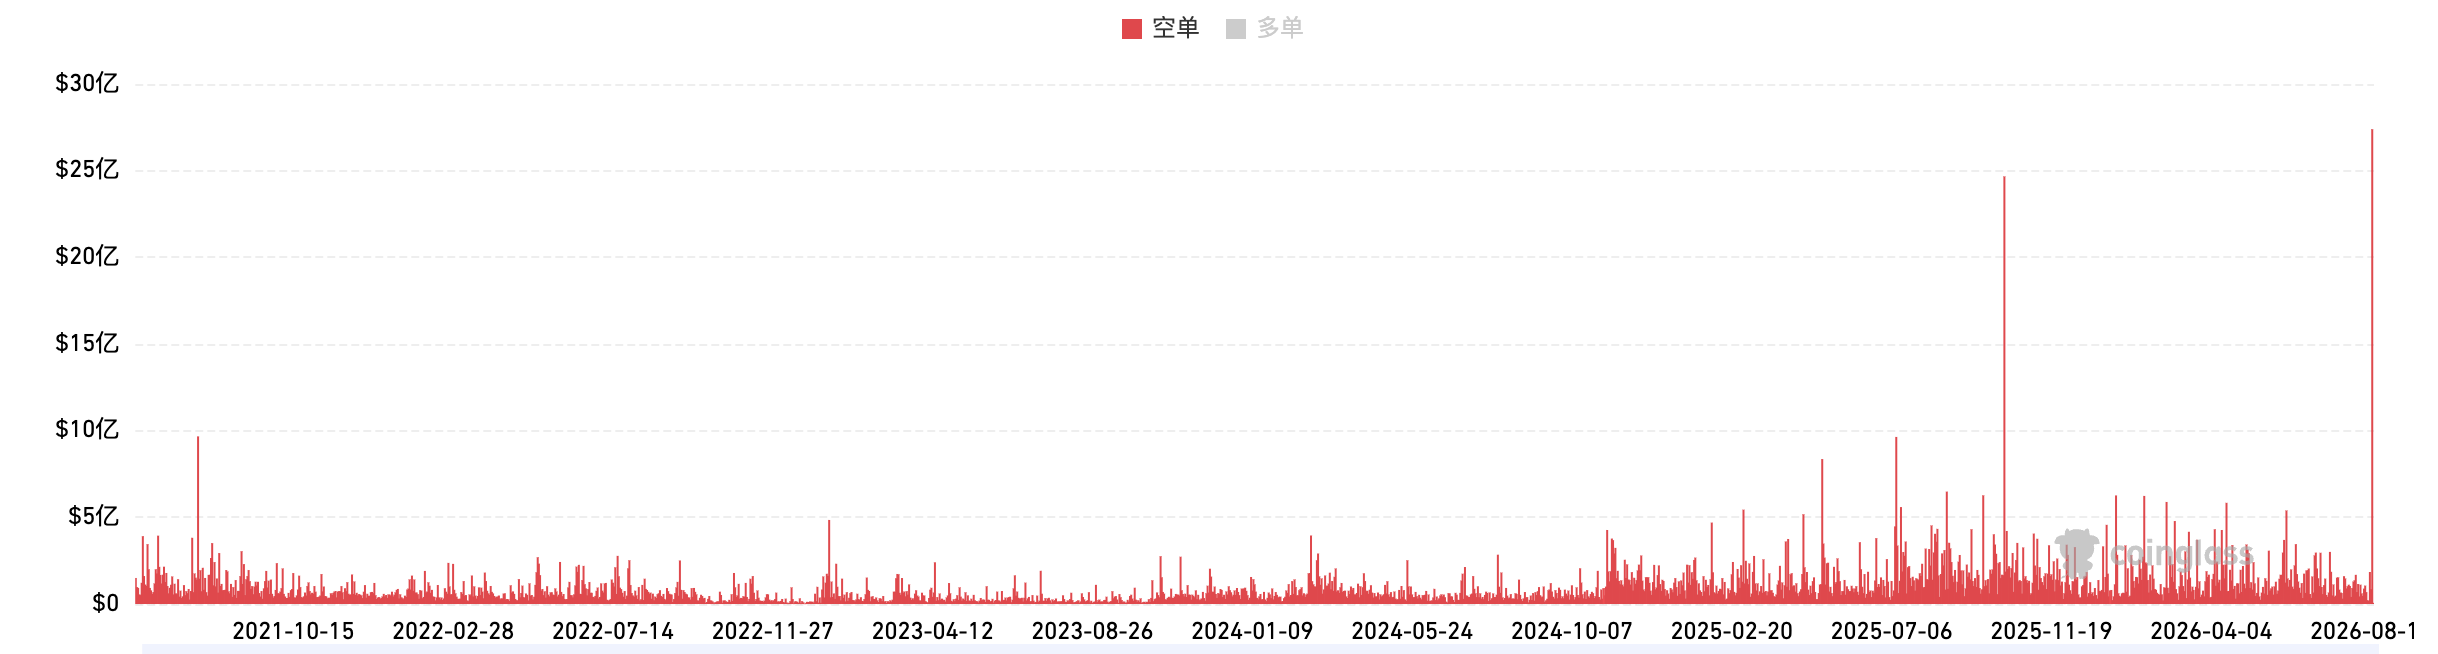
What is more noteworthy is that this liquidation almost showed a one-sided pattern of bears squeezing.
According to CoinGlass data, in the past 24 hours, the amount of short liquidation reached US$2,743 million, far exceeding the liquidation scale of about US$243 million for longs.
This figure even surpassed the scale of short liquidation of about 2.46 billion US dollars on the biggest liquidation day in history on October 10, 2025.
It set a new record for the size of single-day short liquidations in the crypto market.
The crypto market has welcomed multiple benefits, and Trump's bullish remarks ignite optimism
Behind the collective reversal of the crypto market's decline, it is mainly due to improved macro-liquidity, bearish shortfall,
Driven by multiple factors such as regulatory optimism and the return of ETF funds.
At the macro level, the US Treasury expanded the scale of long-term treasury bond repurchases, which became the core trigger for this round of market recovery.
The Ministry of Finance announced that it will double the maximum limit for a single liquidity support repurchase of 10-year to 30-year treasury bonds from at least 2 billion US dollars to 4 billion US dollars.
The measures have been implemented since September 9 and will last until November 4. The market generally interprets this as strong support for the liquidity of the treasury bond market.
Long-term yields were effectively reduced, and the yield on 30-year treasury bonds declined markedly from a high level of about 5.33% to 5.34%.
Meanwhile, the decline in US bond yields led to a weakening of the US dollar, and overall financial conditions improved, which directly boosted the performance of risk-prone assets such as Bitcoin.
The regulatory and policy levels are also sending positive signals. The US SEC proposed new rules for issuing crypto assets this week.
It is proposed to exempt some digital asset issuance registration requirements to provide more space for industry financing,
These include two financing exemptions and a safe harbor arrangement.

At about the same time, on August 19, US President Trump met with executives of crypto companies such as Coinbase, Kraken, and Blockchain.com at the White House.
In addition, representatives of traditional financial institutions such as the Intercontinental Exchange and NASDAQ attended the meeting with SEC and CFTC heads.
Trump made an unequivocal statement in support of cryptocurrencies at the conference, claiming that the US government has completely ended the war on cryptocurrencies.
The industry is booming. He emphasized that the US must stay in Bitcoin, cryptocurrencies,
Undisputed leadership in fields such as forecasting markets and artificial intelligence, and is committed to becoming the world's cryptocurrency capital;
At the same time, it was revealed that the government has discussed accumulating a considerable amount of Bitcoin and other cryptocurrencies, believing that cryptocurrencies have greatly reduced the pressure on the dollar.
Trump also urged Congress to pass a fair version of the Clarity Act as soon as possible, believing that this will help the US get ahead of China and other countries.
It also mentioned that the SEC Chairman is working to introduce Hyperliquid into the US market in a compliant manner, while reviewing the Genius Act that has already been signed,
Policy results such as strategic Bitcoin reserves and a ban on CBDC. This series of favorable statements quickly ignited market optimism.
Even a number of Trump-related meme coins have risen to varying degrees.
At the same time, the forced liquidation of large-scale short positions became an important accelerator for this round of gains.
Previously, the market had accumulated a large number of short positions. As prices quickly broke through key resistance levels, these positions were forced to close one after another.
An obvious shorting effect was formed, which further amplified the upward momentum.
Furthermore, the financial level has also provided some support. In the past two days, the US Bitcoin Spot ETF recorded a cumulative net inflow of over 480 million US dollars.
The net outflow trend, which was sluggish some time ago, was successfully reversed, injecting substantial impetus into spot buying.
Bitcoin is still in the “capitulation phase”, and the perfect bottom may be difficult to find
Prior to that, Bitcoin experienced several months of adjustments, and market volatility fell to a cyclical low, and was even lower than the historical trading day of about 98.5%.
The long period of low fluctuation and price consolidation has brought the market into a clear “dormant period”.
As prices begin to rebound from a low level, the focus of market attention also gradually shifts to whether the low volatility is actually being broken and where the next round of the market will go.
According to CryptoQuant data, Bitcoin spot demand is about to turn positive for the first time since February this year.
Historical data shows that after similar signals appeared, Bitcoin's median increase of about 18.1% over the next 60 days, and the upward win rate was about 78%.
A correction in spot demand usually means that actual market buying is increasing. If this trend continues, it may provide further support for subsequent market conditions.
Glassnode's latest weekly report indicates that high real interest rates are still the main macro factor currently suppressing the price of Bitcoin.
Although the price of gold has broken through 4,400 US dollars and the price of oil has risen to the middle of 80 US dollars, Bitcoin has failed to keep up with the rise of other scarce assets.
It still mainly manifests itself as a risky asset that is highly sensitive to liquidity.
On-chain data also shows that the market is still bottoming out.
Currently, Bitcoin's spot price and short-term holder cost base ($68,500) are below the real market average ($75,800).
This means that the price is still operating below the cost base of recent buyers and the wider range of active investors, and the capitulation phase is not yet completely over.
At the same time, the peak of unrealized losses was about 0.25, which is significantly lower than the level of over 0.6 in the previous cycle, indicating that the magnitude of the pullback in this round is relatively limited.
Moreover, the selling pressure on the market is more scattered. The realized profit to loss ratio is currently around 0.75, which is also higher than the historical level where seller exhaustion is usually below 0.5.
This means that the market has yet to enter the typical seller-exhaustion phase.
Off-chain metrics, on the other hand, showed some signs of improvement. The demand for perpetual contracts has turned positive.
The outflow of funds from the US Bitcoin Spot ETF also stabilized from the previous low of around 5,000 BTC per day.
However, the Coinbase premium is still in a negative range, and the implied volatility is reduced to the low point of the cycle.
It shows that spot market participation and investors' confidence in the direction have yet to recover significantly.
According to well-known trader Killa, Bitcoin has rebounded from a low level, and trying to wait for the “perfect bottom” may cause investors to completely miss the subsequent rise.
Instead of going short to wait for a price that might never arrive, he is more inclined to establish exposure ahead of time and accept any retracements that may occur in the process.
Killa believes that the Bitcoin cycle is changing, and many indicators already support this judgment, and the traditional four-year cycle may eventually change.
Therefore, he is willing to continue buying at different prices such as $70,000, $65,000, $60,000, or $55,000.
Instead of sticking to a single bottom goal. In the longer term, the price of Bitcoin will rise above $150,000.
Instead of trying to accurately capture the lowest point, he preferred to gain market exposure first and then adjust dynamically according to market changes.
Asset management company VanEck said in its latest report that Bitcoin has now triggered 8 of the 12 market “capitulation” indicators.
This means that the state of the market is gradually approaching the bottom of the historical bear market. However, VanEck also emphasized,
These indicators do not prove that Bitcoin has bottomed out; they are more suitable for judging the market's cyclical position rather than as a short-term bottoming signal.
In the past three months, all 12 indicators have reached the trigger range.
The agency pointed out that judging from the historical cycle, Bitcoin experienced the biggest declines of about 94%, 85%, 84%, and 78% in previous rounds of the bear market, respectively.
However, there is a clear difference between the past few cycles and the current market. Spot ETFs were not an important funding channel in the market at the time.
The size of institutional holdings is also relatively limited, and it has also experienced the impact of large-scale industry events such as Celsius and FTX.
Therefore, simply applying the decline in the past cycle to determine the bottom of this round may not be fully applicable.
At the same time, from a cyclical perspective, VanEck has counted 4 complete Bitcoin cycles since 2011,
It was discovered that the bear market lasted an average of about 11 months from top to bottom. If the 2011 special cycle was excluded, the average was about 12.7 months.
Bitcoin has now entered its 10th month of falling back from its high in October 2025, and the next potential accumulation window may appear from September to November this year.
From this perspective, VanEck believes that the current capitalization index is more suitable as a tool for long-term investors to determine the position of the cycle, rather than a short-term bottoming signal.
Historical data shows that the advantages of investing based on these indicators are mainly reflected in a one-year cycle, and the market may continue to fluctuate in the coming months.
Leaving aside internal cryptographic signals, Geoff Kendrick, head of digital asset research at Standard Chartered Bank, interpreted the direction of the market in terms of macro-liquidity changes.
Geoff Kendrick said that as the US Treasury expands liquidity support for the long-term treasury market, Bitcoin could rise to $100,000 by the end of 2026.
If it effectively breaks through $65,500, it may mean that a low point in the current market cycle has been formed.
In his view, the US Treasury's expansion of long-term treasury bond repurchases is an important catalyst in the current market environment.
Liquidity in the bond market is supported, and long-term yields are falling, which may further improve overall financial conditions.
And this is exactly the environment where risky assets such as Bitcoin are more likely to benefit.
Kendrick even described the Treasury's expansion of bond repurchases as “Bitcoin's favorite environment.”
It is believed that Bitcoin has benefited from liquidity intervention many times before, and that its fixed supply mechanism also makes it resistant to currency depreciation.
Strive CEO Matt Cole said more bluntly that Bitcoin may face the strongest macroeconomic downturn in the next 5 to 7 years.
Matt Cole pointed out that the US dollar index (DXY) has been on a structural downward trend for more than 10 years.
Currently, it may be approaching a much larger downtrend, which will have a significant impact on Bitcoin.
If this judgment holds true, the next 5 to 7 years could become one of the most favorable macro-environments in Bitcoin's history.
The long-term downward trend of the US dollar index since the late 1960s is not only reflected in “lower highs and lower lows” in technical form,
It is also supported by US fiscal fundamentals.
Meanwhile, Matt Cole said that looking back at the past few rounds of the Bitcoin bull market, the weakening of the US dollar often coincided with the rise of Bitcoin.
For example, during the 2017 market, the DXY dropped from about 103 to 88; in the 2020-2021 cycle,
The US dollar index also fell from about 103 to around 89; while Bitcoin hit a record high in 2025, the US dollar index also weakened from about 108.
Therefore, if the long-term trend of the US dollar eventually breaks further, the market may underestimate the macro environment Bitcoin will be in for the next few years.
If the long-term trend of the US dollar, which has been formed over 45 years, finally breaks downward, Bitcoin may usher in a macroeconomic downturn that far exceeds the historical cycle.
Taken together, the crypto market has now shown some positive signs, reviving long-term sluggish volatility.
However, whether the market can strengthen further as a result still needs to be continuously verified by demand, liquidity, and the macro environment.
For investors, perhaps more important than accurately predicting the bottom is to maintain moderate exposure under reasonable positions and adjust strategies in a timely manner as the market changes.
Twitter:https://twitter.com/BitpushNewsCN
Compare the TG exchange group:https://t.me/BitPushCommunity
Compare TG subscriptions:https://t.me/bitpush
