叙事 · 3479

The BSC meme coin Bicat rose more than 780 times during the day, and its market capitalization once exceeded 4 million US dollars

Comparative news, according to GMGN data, the BSC meme coin Bicat rose for a short time. At one point, its market capitalization exceeded 4 million US dollars. The daily increase was more than 780 times, and now reports about 3.7 million US dollars. Narratively, Binance posted a picture of a black and yellow two-color cat in December 2025 and asked the community “What would you name this cat?” Flap's official account then replied “Bicat” under the post. Users are reminded that the price of meme coins fluctuates greatly, and investors should be aware of the risks.

38m ago
ZEC has increased 20 times in a year, and the strongest privacy coin favors the intensive catalytic market

Comparative news, according to HTX market data, ZEC rose above 833 US dollars for a short time this morning to set a new historical record. The increase reached 67% in the past 7 days, 230% in the past 180 days, and 1970% in the past year. Recent major benefits include: · Grayscale submitted the fourth S-3 amendment, promoted the conversion of Zcash Trust into a spot ETF (pseudo ticker ZCSH), and disclosed that DCG subsidiaries were in non-binding discussions to inject about 200,000 ZEC (worth about $110 million at the time). · Cypherpunk Technologies, supported by Winklevoss, launched the world's largest ZEC mining cluster, controlling about 18% of the entire network's computing power and continuing to increase the ZEC treasury. · The Ironwood Network Upgrade (NU6.3) has been launched to fix previous Orchard privacy pool vulnerabilities, strengthen the security and verifiability of the shielded pool, and promote capital migration and restoration of ecological confidence. Combined with rising privacy narratives and market bearish pressure, ZEC has become one of the strongest performing privacy coins in this round. Currently, the price is still in a high fluctuation range.

12h ago

Analysis: Behind PUMP's monthly doubling, positive ecological feedback is the main driver

Comparing news, PUMP has continued to rebound since hitting a low of $0.001 at the end of June. It has risen about 19% in the past 24 hours and is close to $0.004, up 36% on the 7th, 98% on the 30th, and about 116% on the 90th. The crypto market has picked up in the past two days. Bitcoin once surpassed 79,000 US dollars. Some meme coins, such as PEOPLE, NEIRO, and BOME, are on the Binance rise list, which is in line with the common rhythm of market recovery and memes taking the lead. However, PUMP's rise was significantly earlier than the current market round, starting about two months earlier. PUMP's strong rise this time is driven by its fundamentals: Pump.fun is forming a positive feedback cycle of revenue, buyback, and traffic. On-chain data shows that in the past 30 days, the platform's processing fee was about US$38.15 million and revenue was about US$29.19 million, second only to Tether, Circle, and Canton, surpassing agreements such as Hyperliquid, Polymarket, GMGN, and Tron. The window that appeared in Gold Fork coincided with the re-acceleration of revenue, the continuous repurchase and destruction of PUMP, and the return of users trading on the platform. Pump.fun uses 50% of revenue to buy back and destroy PUMP. The recent weekly fee revenue surpassed $10 million (one of the best levels since the end of January), corresponding to potential buyback pressure of around $5 million. The platform recently launched Callout Rewards and reduced Solana transaction fees to 0% and cross-chain fees to 0.1%, using revenue advantages to subsidize traffic and compete with users of imported products such as GMGN and Fomo. If active weekly and daily active trading users continue to reach new highs, PUMP's market narrative may shift from a simple meme platform coin to a trading portal with high cash flow. Overall, this round of growth was driven by technical signals and positive feedback from fundamentals, with revenue scale and repurchase mechanisms being the core supporting factors.

1d ago
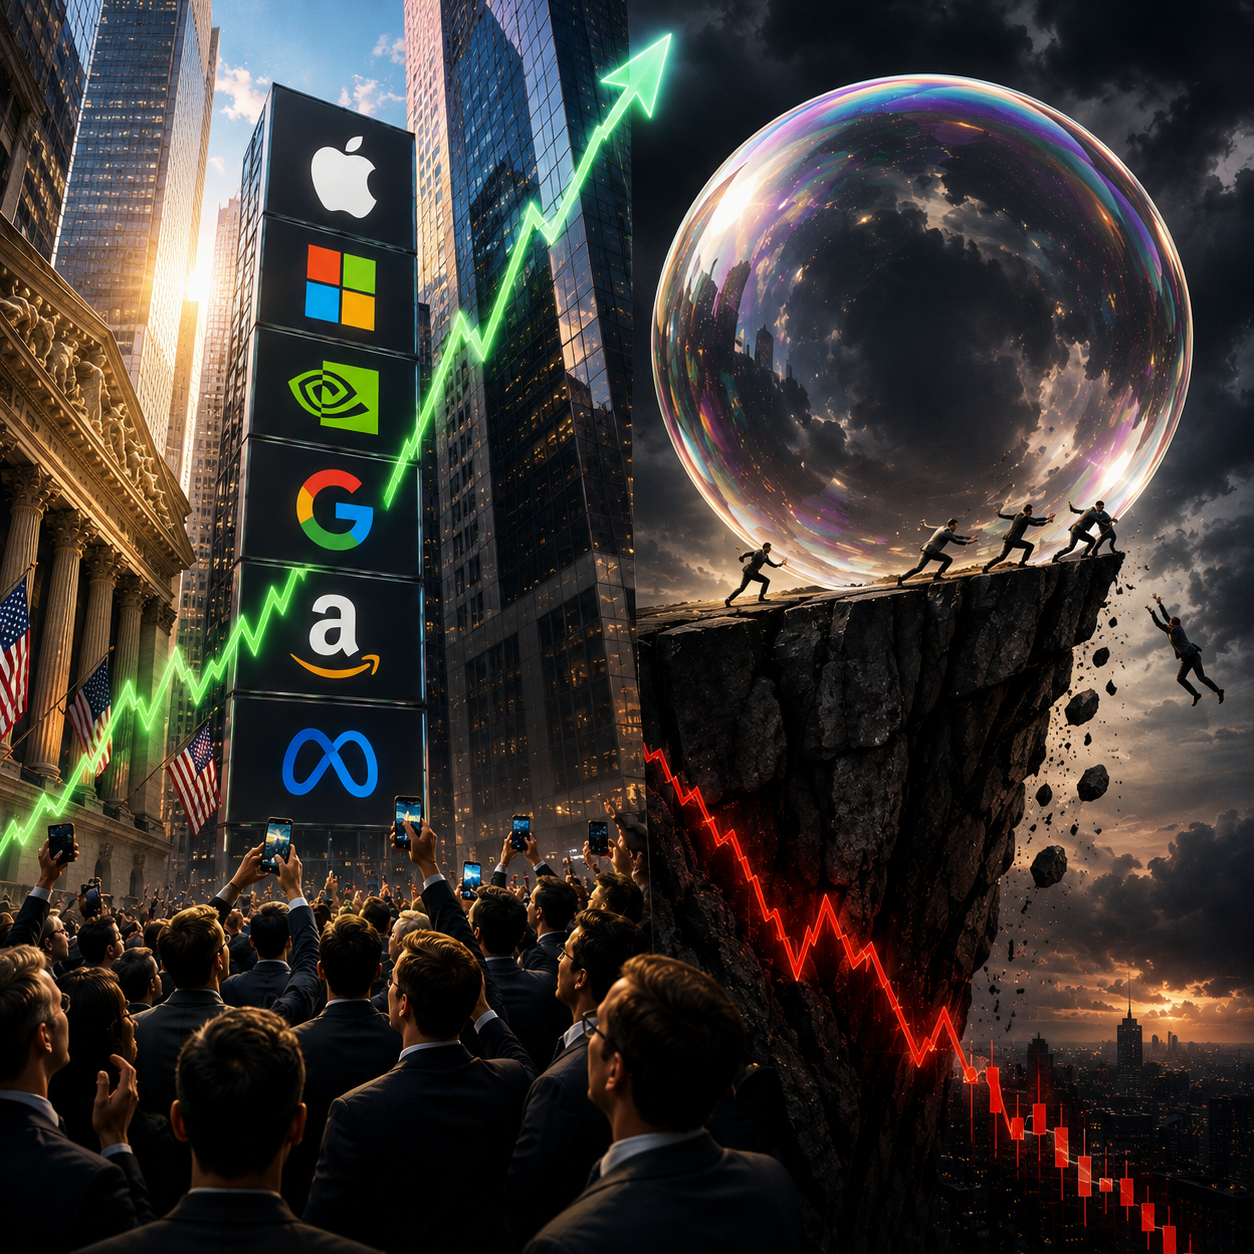
US Stock Value Investing Is Heading Into Another Trap

US Stock Value Investing Is Heading Into Another Trap

Source: Shenchao TechFlow Original title: (Opinion: Value investing in US stocks is not equal to fundamental investment) When “fundamentals are dead” becomes a consensus, investors who blindly organize giants will eventually experience astonishing capital destruction. Guide: When the market shouted “fundamentals are dead” and the capital frenzy formed a group of tech giants, the author used an astronomy discovery to unravel the logical loopholes behind this narrative. Starting from the composition of valuation multiples, this article reminds investors to distinguish between the true quality of an enterprise and the premium that the market is willing to pay. It is particularly cautionary about long-term allocation in the crypto and technology sector. I promise this introduction won't be as long as the last one on the weather. But please give me 90 seconds. More than 100 years ago, a woman named Henrietta Levitt was doing the tedious job of measuring the brightness of thousands of stars on photographic negatives (the way they were imaged before film appeared). She noticed one characteristic of a class of pulsating stars: the slower they pulsate, the brighter they themselves are. ¹ This might just seem a little interesting today, like “OK, that's pretty cool.” But at the time, astronomers couldn't tell the difference between a dark star very close to Earth and a very bright star far away. For them, the two left the same stain on the photographic film. Visual brightness is a messy mix of these two variables: how bright the thing itself is, and how far away it is from us. Henrietta's work decouples these two things: if you can observe the rate of pulsation, you can know its true luminosity; if you know its true luminosity, you can reverse the distance based on how dark it looks. Astronomers call it “standard candlelight.” A few years later, a man named Edwin Hubble discovered one of these pulsating stars, applied Levitt's math, and discovered what he had always thought was a cloud of gas within our galaxy; in fact, it was an entire independent galaxy, one million light years away. So in simple terms, the observable universe has grown about a trillion times larger, just because one person has figured out how to tell the difference between what things look like and what they actually look like. That in itself is obviously pretty cool. But another interesting thing is that around the same time period, two other astronomers each independently drew a scatterplot. One axis was actual luminosity, and the other axis was temperature. They discovered that stars are not randomly distributed in this space, but rather clustered into different families. The meaning behind this is: stars with the exact same visual brightness may and do belong to a completely different family, have a completely different past, and most importantly, have a completely different future... So what is written in the star? Over the past few years, there has been much discussion about markets, narratives, capital, company building, and financial nihilism. This feeling seems to have reached a feverish climax as the tech and financial world begins to face a very different future than a few decades ago. What is particularly clear is that separating progress from asset prices has become more noisy and in many ways more repulsive. But as an investor who makes a living by buying assets that (hopefully) outperform, a simple framework is: forward returns are roughly equal to growth in fundamentals multiplied by changes in valuation multiples (and multiplied by the dividends you've collected along the way). In this case, the valuation multiplier can very cleanly correspond to the smudges on the photographic film. It's an observable data point, but it entangles two things that the market can't directly see: how good the company actually is, and how far (or how long) its future cash flow is now. I think most of the money that can be made comes from investors who are most capable of unraveling these two variables earlier than others (or “perception of differences”), and we will continue to see astonishing capital ruin for investors who treat their stains as stars. Value investing is not equal to fundamental investing. I think there is a misunderstood view: fundamental investing has historically dominated the creation of excess returns. Most of these legends come from the Graham, Buffett, and Tiger Foundation lineage, as well as numerous narratives built around this group of people. It is believed that by some point in the 2000s, this approach was no longer effective, and anyone who invested in this way was overwhelmed by momentum, trends, and “direct buying tech giants.” The conclusion was (and still is?) It's “fundamentals are dead.” ² The modern version of “fundamentals don't matter” itself isn't stupid. It's rooted in a lot of ideas that many of us on the Compound team have written before. The biggest companies get the most mechanical purchases, and the software industry has a winner-take-all economic law. AI means that giants can transform scale into moats faster than challengers, and there are also reasons why the market's microstructure embeds momentum more deeply into our market infrastructure. These are all real...

1d ago深潮TechFlow#US stocks
Whoever sings down Anthropic may be disappointed

Whoever sings down Anthropic may be disappointed

Author: Alan Walker, Silicon Valley Original title: Is Anthropic's Growth Slowing Down? Source of controversy. Claude Code ARR tracking chart produced by TickerTrends. The latest data is $15.12 billion for the week of August 10, 2026, accounting for 21.9% of Anthropic's total ARR. Please note: This is an estimate from a third party agency and is not an official disclosure of Anthropic. The first section below explains how important this difference is. Alan Walker from Silicon Valley made an appointment for dinner in Hong Kong. After some hard work, he discovered that this picture had been retweeted more than 30 times, and the matching statement was similar — “Anthropic's growth has leveled off; 2 trillion dollars is a bubble.” Alan saved the image, zoomed it in, and looked at it again. The problem isn't in this picture. This picture is very well done, and the data is probably done seriously. The problem is that almost everyone who retweeted it was using it to answer a question it couldn't answer at all. 01 Let's first figure out who made this picture, there is a Claude icon in the upper left corner. The color scheme is Claude's familiar orange. At first glance, it looks like an official product. It's not. The author of this picture is TickerTrends and has his name written in the upper right corner. It is a third-party data tracking agency that uses various external signals (application data, payment panels, recruitment, channel caliber, etc.) to estimate the revenue of an unlisted company. The line in the picture is written very honestly: “tracked allocation” -- the percentage of allocations that have been tracked. Let's be clear: Anthropic has never publicly disclosed Claude Code's individual ARR numbers, not once. Every point on this curve has been estimated by an outsider. For example, this is like someone using “long queues at the entrance of a restaurant every day” to estimate its turnover and then draw a beautiful weekly curve. The length of the team does correlate with turnover, but in the middle there is turnover rate, customer unit price, takeout ratio, private room business — you see that the team is three short weeks, and the kitchen is probably being renovated in those three weeks. What is more important is the caliber itself. ARR's algorithm is “revenue for the most recent period times 12.” Enterprise software contracts are not executed evenly every day; they are signed batch by batch. Big orders signed at the end of a quarter will jump a week's curve by a large margin; if the next quarter's big orders aren't signed, the curve will go sideways. Weekly ARR tracking is extremely insensitive to this kind of blocky landing—it will paint the “pace of signing” as a “change in demand.” In a nutshell, what you have in your hand is an unofficial weekly map estimated by an outsider, with a very blunt caliber. Judging by the weight of the “bubble” under it is tantamount to using body temperature to measure blood pressure. 02 I hit myself in the face on this picture. I haven't seen anyone mention it, but it's the most interesting part of the whole thing. The picture shows two numbers: Claude Code is $15.12 billion, or 21.9% of Anthropic's total ARR. By dividing: calculate 15.12 billion ÷ 21.9% = about $69 billion. This is Anthropic's total ARR for the week ending August 10, implied by this image. The official caliber figures reported by Bloomberg, Reuters, and CNBC on August 17 were — $65 billion at the end of July. Clear: This chart, which is being used to prove “slowing growth,” its own implied total number of companies is 4 billion US dollars higher than the official figure ten days ago. Further 10 days until today, if the trend continues, more than 70 billion is a reasonable estimate (this sentence is an inference, not data). In one sentence, people who retweeted only read the number 151.2 and the height of the column, skipping the 21.9% next to it. And that 21.9% said: This company went a step further when everyone shouted “it's slowing down.” I only believe in the two numbers on the same picture that is beneficial to my opinion; this is not called analysis. 03 You are looking at the picture below. The money in the picture above has the upper and lower two pieces. Above is the absolute amount (how many billion dollars), and below is the percentage change (how much more than a percent increase from four weeks ago). The vast majority of people's reasoning is: below...

1d agoWendy#Anthropic #ARR #IPOs #MiniMax
The Ministry of Finance took steps to reduce long-term interest rates, and gold and Bitcoin rose sharply in response

The Ministry of Finance took steps to reduce long-term interest rates, and gold and Bitcoin rose sharply in response

Author: Cookie Original title: Bond Market Fright, How Can a Buyback Detonate Gold and Bitcoin? On August 18, the US 30-year Treasury yield hit 5.337% intraday, a new high since April 2007. The last time this number appeared on the screen, the iPhone had just been launched, and Lehman Brothers was still a Wall Street giant. In less than 24 hours, the Ministry of Finance was in action. On August 19, the US Treasury Department announced that it would at least double the scale of liquidity-supported repurchase operations for long-term nominal treasury bonds, raising the upper limit of a single operation from 2 billion US dollars to no less than 4 billion US dollars, covering the two ranges of 10 to 20 years and 20 to 30 years, effective September 9 and continuing until November 4. Within minutes of the news, the 30-year yield plummeted from around 5.337% to 5.192%, a drop of about 15 basis points. Gold surged more than $125 to $4,487 per ounce in a single day, a new high since June 4. Bitcoin pulled up 8.7% from an intraday low of $64,112 to $69,700, approaching the $70,000 mark for the first time in two months. Ethereum rose nearly 19%, and the crypto market liquidated more than $20 billion in 24 hours, of which $1.44 billion was liquidated by bears. How did a buyback cause a huge shock in the global market? What is a buyback? Treasury buybacks and the Federal Reserve's QE are two different things. QE is when the central bank prints money to buy bonds, directly injecting new liquidity into the market. However, the Ministry of Finance buybacks up old bonds that the Ministry of Finance uses money from its own accounts to buy back those “old and no one wants to trade”. The purpose is to renew liquidity to the market so that market makers are not “priceless” in the long-term treasury bond market. For example, there is a used car market in your neighborhood, but recently no one is buying used cars. Car dealers have stocked up a bunch of used cars and can't sell them, and the price of new cars is being dragged down. At this point, the property came forward and said, “Used cars will be purchased uniformly by the property; at least this much will be collected. As a result, car dealers had cash in their hands, and the liquidity in the new car market also slowed down. The Ministry of Finance is doing this “property” job. It is buying back “off-the-run” bonds, that is, old securities that are no longer the latest issue and have a scarce trading volume. After institutions that sell old coupons get cash, they can reallocate them to new coupons with better liquidity. As a result, the trading price spread in the entire long-term market narrows, and transaction friction is reduced. The Ministry of Finance did not create money out of thin air. The source of funds for the repurchase was the Ministry of Finance's General Account (TGA), and the TGA money came from taxes and newly issued short-term treasury notes. This means that while long-term supply is declining, short-term supply is increasing, and the total amount of debt has not changed; only the term structure has changed. Why are yields out of control? To understand the urgency of this repurchase, we need to go back to what the bond market has experienced in the past five months. The war in Iran was the trigger. After the US-Iran conflict broke out in late February, passage through the Strait of Hormuz was blocked, and Brent crude oil climbed all the way from the pre-war range of $70 to $91 recently. The sharp rise in energy prices directly boosted inflation expectations, while the Federal Reserve kept interest rates unchanged (3.5% to 3.75% range) at the July interest rate meeting. Three members of the committee even voted against raising interest rates, and the market began to set prices “higher for longer.” But the rise in yield was not only driven by inflation. Fiscal deficits are a deeper structural strain. The monthly deficit in July reached US$432.3 billion, the largest monthly gap since March 2021. The annual deficit is likely to be over $2 trillion, accounting for about 6.4% of GDP. The total national debt is close to $40 trillion, and the public holdings are about to reach 100% of GDP. More importantly, over the next 12 months, $10 trillion of treasury bonds will need to be rolled over. This means that the Ministry of Finance must continue issuing a large number of new bonds in an already indigested market. The long-term market began to show signs of a “buyers' strike” in late June. The winning bid yield for both auctions set new records for more than ten years: the 10-year auction interest rate is 4.683%, and the 30-year auction interest rate is 5.216%. When the yield hit 5.337% on August 18, US Treasury Secretary Bezent's window of choice was already very narrow. The biggest significance of this repurchase of Bezent's undercard is probably to let the market see Bezent's bottom card. On the face of it, the Ministry of Finance said, “Market participants have given a large number of high-quality offers, so expand the scale of operations to provide better liquidity support.” But the city...

2d agoburnking#Bitcoin #gold

Arthur Hayes: Flop Labs will create a decentralized computing power network, and testnet participants will receive about 20% of the token supply

Comparing news, Arthur Hayes published the article “The Book of Genesis” to explain the core ideas and token economy design of his AI/crypto project Flop Labs with mythological narratives. He pointed out that the AI market currently lacks uniform computing power pricing standards, and the definition and pricing of “tokens” vary from model to model. Hayes proposed the construction of Flop Network, a decentralized computing power network, using FLOP as the native token to represent direct claims for computing power (FLOPs), so that AI agents and humans can trade at a globally unified computing power unit price. The FLOP token economy uses a fair launch model, the team is self-funded, and there are no pre-sales. Miners receive FLOP block rewards and inference fees by providing “proof of useful reasoning” (PoUI) mining, and AI agents can use $FLOP to buy computing power (“food”) and obtain lasting memory (“personality”) in combination with decentralized storage. Testnet participants will receive approximately 20% of the token supply (distributed over ten years). Hayes said that if AI agent economic predictions come true, Flop Network's value may far exceed Bitcoin.

2d ago

Analysis: This round of Bitcoin's rise was driven by heightened optimism about crypto regulations and the expansion of the scale of US bond repurchases

Comparative news, according to Bloomberg, as industry executives gathered in the White House and market regulatory optimism was heating up, Bitcoin broke through a multi-month trading range on Wednesday, once rising 8% to about $69,500, the biggest increase since March, and rose to the highest level since early June. Trump is expected to hold meetings with executives from companies such as Coinbase, Payward, and Blockchain.com. Axel Rudolph, IG's chief technical analyst, said that this round of gains towards $70,000 was triggered by bears' recovery, indicating that buyers' confidence is recovering, but whether the market can maintain momentum and further challenge the $75,000 area still faces a critical test. Bitcoin returned to the 100-day and 200-day EMAs simultaneously on Wednesday. According to Coinglass data, the rapid rise triggered more than $1 billion in liquidations within an hour, with a liquidation scale of about $1.5 billion over the past 24 hours. On the regulatory side, the US SEC proposed this week that some digital asset issuance exempt securities registration requirements are required to help companies in the start-up and financing stages. Meanwhile, the US Treasury Department announced that it will at least double the scale of liquidity support repurchase operations for 10-year to 30-year treasury bonds, driving US bond yields and the dollar downward. Joshua Lim, co-head of marketing at FalconX, said that while the market has been flooded with sales over the past few weeks, Bitcoin remained strong in the $60,000 low area, which subsequently drove a shift in market sentiment and narrative. Bitcoin options holdings are mainly concentrated around $60,000 put options and $70,000 call options, according to Deribit data.

2d ago
Wall Street Q2 holdings revealed: as institutions fall and buy more, ETH outperforms BTC across the board

Wall Street Q2 holdings revealed: as institutions fall and buy more, ETH outperforms BTC across the board

Source: ChainCatcher Author: Zhou Original title: Q2 Wall Street Institutional Crypto Positions: Most institutions bucked the trend, and ETH exposure completely outperformed BTC in the second quarter. ETF capital flows and institutional behavior were decoupled, and the institutionalization of crypto assets deepened; at the same time, institutional differences over crypto-related stock targets are also getting bigger. August 14 is the legal deadline for the US SEC to require institutional investors to submit Q2 13F forms. After the centralized disclosure of documents, Wall Street's crypto holdings were once again spread out on the table. There was a clear contrast between institutional movements and currency price trends this season. The price of Bitcoin fell by about 14.2%, while crypto holdings declared by institutions increased. According to Bitcoin Strategy's calculation of 13F data, institutional Bitcoin holdings increased 7.5% from about 498,000 to about 536,000, up 7.5% month-on-month, while total ETF holdings fell from about 1.297,000 to about 1,211,000 during the same period. According to SosoValue data, the US spot Bitcoin ETF continued to make net redemptions in the second quarter, with net outflows of about 2.4 billion and 4.5 billion US dollars in a single month in May and June, respectively. Among them, June set the worst monthly record since listing. The Ethereum ETF also had a cumulative net outflow of around $700 million over the same period. At the same time, the chips are concentrated on the head. The number of institutions declaring Bitcoin holdings dropped from about 2,000 to about 1,900. According to Bloomberg data, as of August 13, the number of institutional holders of an IBIT product reached about 1,500, with a net worth of about US$47.35 billion. The growth rate of Ethereum on the bank side completely outperformed Bitcoin. Previously, ChainCatcher wrote in the first quarter position review: Institutional interest in Ethereum's allocation is increasing, and Jane Street, Wells Fargo, and J.P. Morgan Chase all added Ethereum ETFs during the outflow phase. In the second quarter, this sign was confirmed on the bank side. According to DWF Labs estimates, in terms of the number of corresponding crypto assets, Morgan Stanley's exposure to BTC increased 3.7% month-on-month and ETH exposure increased 18.6% in the second quarter. J.P. Morgan's BTC exposure increased 12.2%, and ETH exposure increased 67.3%. Both banks are growing at a significantly higher rate of ETH than BTC. The individual level is more intuitive. Morgan Stanley's ETHA increased by about 202% to 4.6 million shares, J.P. Morgan's ETHA increased by about 338% to nearly 1.17 million shares, and Bank of America ETHA increased from about 67,500 shares to about 1.98 million shares, about 29 times the previous one. But in fact, there was an overall net outflow of Ethereum spot ETFs in the second quarter. According to SosoValue data, there was still a net inflow of about 356 million US dollars in April, net outflows of about 541 million and 529 million US dollars in May and June respectively, and a total net outflow of about 714 million US dollars in the second quarter. Jane Street bought it back. Hedge funds moved their positions into options. Last season, Jane Street cut IBIT holdings by about 71%. The market once speculated that it was bearish on Bitcoin. This quarter, it reversed IBIT and added back about 24.9 million shares, a sharp increase of about 324% over the previous quarter, making it one of the biggest buyers of the quarter. Its current spot Bitcoin ETF exposure is approximately $9.9 billion, of which approximately $828 million is in IBIT. As an authorized participant and market maker, its end-of-quarter inventory is related to redemptions and hedging, and a large amount on spot is not equal to a directional bet. It is worth noting that 13F only reported a long spot volume at the end of the quarter. If options were added, the image of several institutions would also reverse. Global macro hedge fund Brevan Howard cut spot IBIT from 24.3 million shares to 7.21 million shares in the second quarter, reducing its holdings by about 70.4%. But it also holds a call option corresponding to approximately 7.23 million IBIT shares and a put option of 5.27 million shares. Graham Capital reduced its current IBIT from about 926,000 shares to 259,000 shares, reducing its holdings by about 72%, while holding down options corresponding to about 1.74 million IBIT shares, with a declared value of about $57.94 million. Multi-strategy giant Millennium reduced current IBIT from about 19.29 million shares to 9.69 million shares, reducing holdings by about...

3d ago22#Wall Street #Bitcoin

Bitcoin Volatility Drops to Cycle Low, Traders Turn to AI Stocks and Predictive Markets

Comparatively, Bitcoin's volatility recently fell to a multi-year low. The actual 30-day volatility was about 42%, while the S&P 500 index was about 18%. The gap in volatility between the two is the smallest in history. The market is at a standoff between buyers and sellers, and the sell-off by enterprises and mining companies limits room for growth, while the clearance of leverage and the continued accumulation of long-term holders limited the decline. As Bitcoin's volatility declined, some short-term traders began to shift their risk appetite to assets such as AI stocks, tokenized stocks, stock perpetual contracts, and predictive markets. According to NYDIG research, short-term traders are more likely to chase volatility, narrative momentum, and potential returns, and traders seeking 5x or 10x returns can now choose between Bitcoin, Nvidia, gold, stock perpetual contracts, 0DTE options, and sporting event contracts. According to the data, the monthly trading volume of traditional asset perpetual contracts on crypto trading platforms has increased from US$52 billion in January to US$268 billion in June, an increase of more than fivefold in half a year. Meanwhile, Korean retail traders have clearly switched from cryptocurrencies to AI-related stocks, and trading volume on major Korean crypto exchanges dropped by up to 80% year over year. CoinDesk pointed out that the Bitcoin market is currently more like a dormant state, where declining transaction participation, deep market contraction, and regulatory uncertainty are all reducing volatility. If US crypto regulations make substantial progress, the macro environment changes, or new market narratives emerge, the current low volatility pattern may be broken, and weak liquidity may further amplify price fluctuations. BTC price on Friday at 5pm EDT$65,500 or above Under $65,500 Powered by Moment Predict. Earn points. Unlock the Airdrop Edit Delete CryptoBTC price on Friday at 5pm EDT$65,500 or aboveUnder $65,500 Resolves Yes if the simple average of the sixty seconds of CF Benchmarks' Bitcoin Real-Time Index (BRTI) before 5 PM EDT is above 65499.99 at 5 PM EDT on Aug 21, 2026. Outcome verified from CF Outcomes. Not all cryptocurrency price data is the same. While checking a source like Google or Coinbase may help guide your decision, the price used to evaluate this market is based on CF Benchmarks' evaluation Real Time Index (RTI). At the last minute before expiration, 60 RTI prices are expensive. The official and final value is the average of these prices. Note: this event is directional.crypto2026-08-222026-08-22t 06:59:59.999 Z https://moment.vision/mapi/uploads/openai/images/20260818180527_351744376fc6f3dc.jpg6a849f2737100b9ab8ae0529

3d ago