


Controlling Bulls and Bears: The Ultimate Guide to Bitcoin's Cycle and Valuation System

Source: Web3 Practitioner
Original title: In-depth analysis of Bitcoin's cyclical mechanism and multi-dimensional valuation system
Cyclical fluctuations in the crypto asset market essentially have a strong correlation with Bitcoin's price cycle. As the “guiding principle” of the crypto ecosystem, Bitcoin not only dominates the dynamic evolution of its own valuation logic in about four years, but also profoundly affects the pricing logic and market performance of altcoins, decentralized finance (DeFi) projects, and other crypto assets through mechanisms such as liquidity transmission and market sentiment anchoring.
Deeply deconstructing the underlying drivers and stage characteristics of the Bitcoin cycle and accurately using multi-dimensional valuation tools is a core prerequisite for grasping market transition nodes and optimizing asset allocation strategies.
I. Core logic and phase characteristics of the Bitcoin cycle
The formation of Bitcoin's four-year cycle is not an accident; it is an inevitable result of the resonance of its endogenous mechanism, market liquidity, and social consensus. This cycle pattern has been fully verified in the past three complete rounds.
(1) Three core elements of cycle drive
1. Halving mechanism: supply-side “scarcity engine”
Bitcoin's halving mechanism (210,000 blocks produced for about 4 years) is the “native driver” of the cycle. The mechanism entered the “supply compression phase” by systematically cutting block rewards (from 50 BTC per block initially to 3.125 BTC after halving in 2024). From an economic perspective, halving Bitcoin's annual inflation rate directly reduces Bitcoin's annual inflation rate, strengthens “deflation expectations,” and in turn generates a “scarcity premium” — a process that not only reduces short-term selling pressure on miners, but also restructures the balance between market supply and demand, and promotes the formation and spread of consensus on price increases. Historical data shows that 12-18 months after each round of halving, Bitcoin often enters the main upward wave in price. Essentially, the market is pricing the “scarcity dividend” ahead of time.
2. Liquidity transmission: the “capital anchor effect” of the market
As a core asset that accounts for more than 50% of the market capitalization of the crypto market (2024 data), Bitcoin is the “primary undertaker” of global crypto liquidity, and its price fluctuations are transmitted to the entire market through multiple channels:
Exchange level: Changes in Bitcoin's leveraged trading (futures, perpetual contracts) positions directly affect the overall leverage ratio of the market, which in turn causes linked fluctuations in altcoins;
On-chain level: Bitcoin, as a mainstream collateral asset, may trigger a chain reaction of the liquidation of DeFi protocols and exacerbate market panic;
Institutional level: Bitcoin is the “doorstep” for institutional capital to enter the crypto market. The inflow and outflow of capital directly determines the overall risk appetite and cost of capital in the market, forming the transmission logic that “when Bitcoin rises, the whole market generally rises, and when Bitcoin falls, the entire market is under pressure”.
3. Social consensus and psychological expectations: the “pendulum effect” of emotions
The Bitcoin cycle is essentially also a “belief cycle” of market sentiment. Each cycle follows the four-stage emotional evolution path of “budding - fanaticism - bubble - recession”, and the psychological curve is highly compatible with the price curve:
Bull market stage: The FOMO (fear of missing out) effect forms a positive feedback cycle of “emotion - price - transmission” — price increases attract media attention, trigger the entry of OTC capital, further push up prices, and ultimately build a popular investment consensus;
Bear market phase: When liquidity declines, funds show the characteristics of “clustered bitcoins” — compared to the high volatility of altcoins, Bitcoin's “safe-haven properties” stand out, and its price drop is usually significantly lower than that of altcoins (in previous bear markets, the average decline of altcoins was over 80%, and Bitcoin fell by about 60%). This phenomenon in turn strengthens Bitcoin's “value storage” consensus and lays the foundation of belief for the next cycle.
(2) Key identification signals for the top and bottom of the cycle
To accurately determine the top and bottom of the cycle, it is necessary to combine multi-dimensional indicators such as price trends, on-chain data, capital behavior, and market sentiment to form a “resonance verification”.
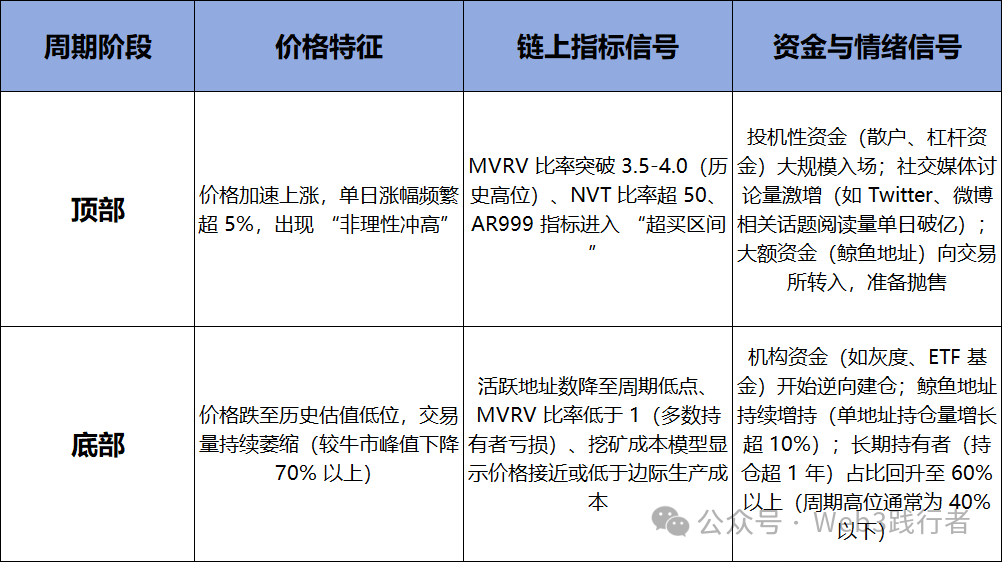
Judging from market laws, the top is often accompanied by an “imbalance between supply and demand” — miners continue to produce but market demand cannot grow at the same time, which eventually triggers a “cliff-style correction” in prices; the bottom is the “ultimate release of pessimism”. At this point, valuation indicators return to rationality, and the “double bottom” of financial and emotional aspects are superimposed to provide conditions for a cycle reversal.
II. Bitcoin's multi-dimensional valuation system and practical application
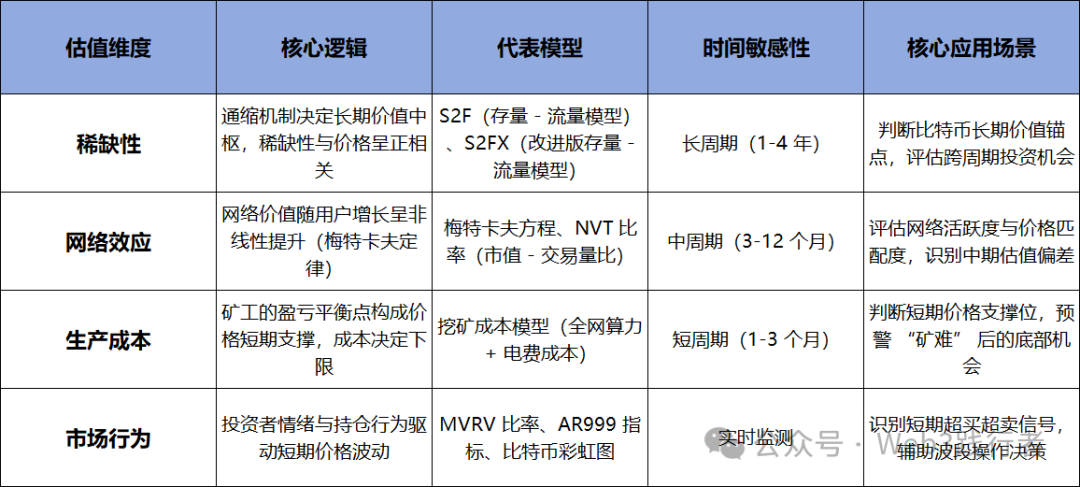
As a non-sovereign, non-profit decentralized asset, Bitcoin's valuation cannot apply indicators such as PE and PB of traditional stocks. It is necessary to construct a four-dimensional analysis framework of “scarcity - network effect - production cost - market behavior” to improve the accuracy and reliability of the valuation through cross-verification of multiple indicators.
Table: Overview of Bitcoin's four-dimensional valuation framework
(1) Scarcity Dimensions: S2F (Stock - Flow) Model
The S2F model was proposed by analyst PlanB in 2019. The core is to measure the “ratio” of assets, quantify the scarcity of Bitcoin, and compare it across categories with traditional “value storage assets” such as gold and silver. It is a core tool for judging the long-term value of Bitcoin.
1. Core model concepts and formulas
Stock (Stock): The total amount of bitcoins currently mined in the market (approximately 19.4 million as of 2024, with a total limit of 21 million);
Flow (Flow): the number of bitcoins newly produced through mining in a specific year (approximately 472,500 units/year after halving in 2024);
S2F ratio: the ratio of stock to traffic. The formula is:
S2F = Total Current Supply/Annual Average New Production
The higher the ratio, the greater the scarcity of assets — for example, gold's S2F is around 62 (about 190,000 tons in stock, adding about 3,100 tons per year), while the S2F of Bitcoin after halving in 2024 is about 41, which is expected to rise to 82 after halving in 2028, and the scarcity will surpass gold.
2. Model application and divergence analysis
Trend judgment: Historical charts show that the price of Bitcoin has been fluctuating along the S2F ratio curve for a long time, and the price usually reflects the increase in S2F in advance (for example, the 2023 market has begun to set early prices for scarcity after being halved in 2024). In order to smooth short-term fluctuations brought about by halving, the model usually uses a 365-day moving average to calculate S2F to form a more indicative trend curve;
Divergence warning: The “divergence chart” below the model is a key risk signal — when the price line continues to be above the S2F ratio line (the back line changes from green to red), it indicates that the price has broken away from scarcity support and entered a “bubble zone” (for example, in November 2021, the price reached 69,000 US dollars, the S2F divergence was over 50%, then a bear market began).
3. limitation
The S2F model is essentially a “supply-side single-factor model,” and does not take into account demand-side variables — demand-side factors such as macroeconomic environment (such as the Federal Reserve's interest rate hike/cut), regulatory policies (such as the crypto asset compliance process), and technological innovation (such as the progress of Layer 2 expansion), which may cause model prediction deviations (such as the 2021-2022 cycle, the model's predicted price reached 100,000 US dollars, which actually only touched $69,000). Therefore, it is necessary to make a comprehensive judgment based on other indicators.
(2) Market behavior dimensions: real-time monitoring of sentiment and valuation
Market behavior indicators focus on “investor sentiment” and “price deviation”. By quantifying market participants' holding costs and emotional enthusiasm, they identify short-term overbought and oversold signals.
1. MVRV Ratio: Index of deviation between position cost and price
The MVRV (Market Value to Realized Value) ratio, or “market value to realized value”, is the core of determining whether Bitcoin is overvalued or undervalued by comparing the current price with the average holding cost of the entire market.
Core Formulas and Concepts:
MVRV = Market Value (MV)/Realized Value (RV)
Market value (MV): current price × circulating supply, reflecting the immediate market pricing of Bitcoin;
Realized Value (RV): Based on blockchain data, the total value calculated based on the price of each Bitcoin when it was last moved, reflecting the “average cost basis” of the entire market (for example, a Bitcoin was last traded at $10,000, and even at the current price of $50,000, its contribution to RV was $10,000).
Signal interpretation:
MVRV > 1: The current price is higher than the average cost across the market, making most holders profitable. When the ratio breaks above 3.5-4.0 (historical top threshold), it indicates that the market is overheated and the risk of price pullback surges (for example, MVRV reached 3.6 in November 2021, then the price fell 75%);
MVRV < 1: The current price is below the average cost in the entire market, and most holders lose money. When the ratio falls below 0.8 (historical bottom threshold), it indicates that the market is undervalued, and bottom-side signals appear (for example, MVRV reached 0.78 in November 2022, then a new round of gains began).
Limitations: In extreme sentiment cycles (such as the late 2021 bull market), MVRV may remain high for more than 3 months, causing “indicator distortion”; however, in the long run, its accuracy rate of judging bull and bear conversion nodes is still over 80%, which is a core reference indicator for long-term investments.
2. Bitcoin rainbow chart: a “sentiment map” of long-term trends
The rainbow chart is a long-term valuation tool based on Bitcoin's logarithmic growth curve. By superimposing colored ranges, price fluctuations are matched to market sentiment, and the cycle position is intuitively presented.
Core logic: As an emerging asset, the price of Bitcoin fluctuates sharply in the short term, but it has a long-term “logarithmic growth” trend (due to an increase in the valuation rate combined with scarcity). By dividing the logarithmic growth curve into different color ranges, the rainbow chart corresponds to different market sentiment:
Blue/purple range (oversold): Prices are below the long-term trend line, market sentiment is sluggish, and it is a “golden pit” for long-term layout (such as December 2018 and November 2022);
Yellow/green range (reasonable valuation): the price is in line with the long-term trend line, market sentiment is neutral, suitable for fixed investment;
Red/orange range (overbought): The price far exceeds the long-term trend line, and market sentiment is fervent, which is a sign of a profit settlement (such as December 2017 and November 2021).
Limitations: The rainbow chart is based on historical price data fitting and cannot predict the impact of black swan events (such as LUNA crash, FTX bankruptcy) on prices; moreover, as Bitcoin's market capitalization expands, its logarithmic growth trend may gradually slow down, and the range threshold needs to be adjusted dynamically.
3. The AR999 Index: A Quantifying Tool for Short-Term Timing and Investment Strategies
The AR999 (AHR999) index was proposed by Weibo user “ahr999”. Combining multi-dimensional data such as hash rate, on-chain transaction volume, and long-term and short-term holders' holding behavior, the () index focuses on quantifying “short-term returns and valuation bias” to provide a basis for fixed dosage band operations.
Core Computational Elements:
Changes in hash rate: reflecting miners' confidence. Continued decline in the hash rate may mean the withdrawal of high-cost miners and increased selling pressure;
Trading volume/market capitalization ratio: Assessing market activity. A low ratio indicates insufficient market liquidity and may amplify price fluctuations;
Long-term and short-term holders' holding ratio: The share of long-term holders (holding positions > 1 year) has increased, indicating a decline in market speculation and a strengthening of the bottom signal.
Signal interpretation:
AR999 < 0.45: The price is low in the cycle, the short-term return expectations are high, and it is suitable for a one-time position increase;
0.45 ≤ AR999 ≤ 1.2: The price is within a reasonable range, suitable for fixed investment (reducing the risk of short-term fluctuations through cost sharing);
AR999 > 1.2: The price is high, there is a high risk of a short-term pullback, and entry is not recommended.
Limitations: After 2022, due to the large-scale entry of institutional capital, the Bitcoin holding structure changed, and the accuracy of AR999's judgment on top and bottom declined, and cross-verification was required in combination with indicators such as MVRV and NVT.
(3) Production cost dimension: the “price support line” of mining costs
Bitcoin's mining cost is the “short-term safety margin” of its price — mining work is the core supplier of Bitcoin, and its break-even line directly affects short-term supply and demand in the market, thereby forming price support.
1. Core metrics of the mining cost model
The calculation of mining costs requires a combination of three variables:
Full network computing power (hash rate): reflects the scale of mining machine investment. The higher the computing power, the higher the mining cost per Bitcoin;
Mining difficulty: The Bitcoin network adjusts the difficulty level every 2016 blocks. Increased difficulty means reduced mining efficiency and increased costs;
Electricity cost: It accounts for 60% to 70% of the total cost of mining, and there are significant differences between regions (for example, the electricity bill for hydropower in Sichuan, China was about $0.02/kWh, and the electricity bill for coal-fired power in Texas in the US was about $0.15/kWh).
2. Core laws and market signals
Cost support effect: Historical data shows that the price of Bitcoin will not be lower than the “marginal cost of the most advanced mining rig” for a long time (for example, the 2024 Ant S19 XP miner's marginal cost is about $25,000). Once the price falls below this threshold, high-cost miners shut down mining machines and reduce the supply of bitcoins; at the same time, some miners choose to buy bitcoins directly (instead of mining) to increase demand and form price support;
Bottom opportunity after the “mining disaster”: When the price continues to fall below cost, triggering a large-scale exit of miners (computing power drops by more than 30%), miners may sell Bitcoin and mining machines in exchange for cash, leading to short-term price declines — this “mining disaster” phase is often the bottom of the cycle (such as a 35% drop in computing power in June 2022, the price falls to $17,000, then rebounds), due to supply-side contraction combined with demand-side bottoming capital, forming a long-term layout opportunity.
3. limitation
Electricity prices, mining machine depreciation costs, and operating costs vary greatly in different regions, making it difficult to form a uniform “cost standard”; moreover, as mining machine technology iterates (such as the potential impact of quantum computation), the cost curve may change structurally, and model parameters need to be adjusted dynamically.
(4) Network effect dimensions: degree of matching between user growth and network value
Bitcoin's long-term value depends on its network effects — growth in user size and transaction activity is the core driving force for long-term price increases. This dimensional index focuses on “the degree to which network value matches user growth.”
1. NVT ratio: “plausibility check” of market capitalization and trading volume
The NVT (Network Value to Transactions) ratio, or “the ratio of market value to on-chain transaction volume,” is analogous to the PE ratio in the stock market, and determines whether the price is reasonable by measuring the “market value corresponding to the unit transaction volume”.
The core formula:
NVT = total market capitalization/on-chain volume (usually a 90-day moving average)
Signal interpretation:
NVT > 50: The market value is too high compared to the trading volume, indicating that the price may be overvalued and the market enters a bubble phase (such as NVT reaching 58 in November 2021, then the price fell);
NVT < 15: The market value is too low compared to the trading volume, indicating high network activity but undervalued prices, which is a potential buying opportunity (for example, NVT reached 12 in November 2022, then the price rebounded).
Limitations: The on-chain transaction volume may include “unreal transactions” such as internal exchange transfers, money laundering, etc., causing NVT to be distorted; moreover, in a bull market and a bear market, user trading habits are different (frequent bull market transactions, poor bear market transactions), and the NVT reference threshold needs to be adjusted dynamically.
2. Metcalfe's Law: A Quantitative Framework for Network Value
Metcalfe's law states that “the value of a network is proportional to the square of the number of active users.” In Bitcoin valuation, this law is implemented through the “NVM Ratio” (Network Value to Metcalfe) to measure “the degree of matching between market value and user size.”
Core applications:
Track the number of daily active addresses (reflecting the size of users) and assess network growth trends;
Calculate the NVM ratio: NVM = market capitalization/ (number of active addresses) ² to determine whether the network value is reasonable.
Signal interpretation:
NVM < 0.6: The network value is below a reasonable level corresponding to user growth, the market is undervalued and suitable for purchase;
0.6 ≤ NVM ≤ 2: network value matches user growth, suitable for fixed investment;
NVM > 2: Network value far exceeds user growth, prices are overestimated, and we need to be wary of pullbacks.
Limitations: The number of active addresses may include exchange hot wallet addresses (non-real users), causing user size statistics to be distorted; moreover, Bitcoin's “value storage” attribute (not payment attribute) may weaken the linear relationship between the number of users and network value, and must be used in conjunction with other indicators.
epilogue
Bitcoin's cyclical rules and valuation system are one of the few historically proven “definitive tools” in the crypto market — but it needs to be clarified that no single indicator or model can predict the market with complete accuracy. Investors should establish an analytical framework of “cyclic judgment + cross-validation of multiple indicators”: in the early stages of the cycle (within 6 months after halving), they can focus on S2F and mining cost models; during the cycle frenzy period (price mainly rising), they need to pay attention to bubble warning indicators such as MVRV and NVT; at the bottom of the cycle (late in the bear market), they can combine AR999 and Metcalfe equations to find layout opportunities.
At the same time, we need to be wary of “indicator dependency traps” — external factors such as macroeconomics (such as the Federal Reserve's policies), the regulatory environment (such as progress in SEC compliance), and technical risks (such as blockchain security flaws), which may break traditional cycle rules. Only by combining quantitative analysis with qualitative judgment can long-term asset preservation and appreciation be achieved in a highly volatile crypto market.
Twitter:https://twitter.com/BitpushNewsCN
Compare the TG exchange group:https://t.me/BitPushCommunity
Compare TG subscriptions:https://t.me/bitpush
