


Disassembling Solana with the most complete data, where exactly is the “golden pit”
Source: The Defi Report
Author: Michael Nadeau
Original title: Solana Went in Year with a Bang. How did it end it?
Compiled and organized by: bitPushNews
SolanaKicking off with a thunder in early 2025, it became Trump's preferred place to issue meme coins, and the first stop for most new users in this cycle. But how did 2025 end?
The current Solana network appears to be entering a period of periodic reset. Demand for on-chain speculation continues to decline, and new application scenarios and access to traditional finance (TradFi) have yet to fill this gap. Operational performance in Q4 weakened significantly: total revenue (REV) fell 43% to its lowest level since Q3 2023; real on-chain yield fell 56% to 0.46%. At the same time, fundamentals deteriorated with user activity, and operating costs rose sharply compared to user expenses.
This article will provide a full review of Solana's Q4 performance through data.
I. Operational performance: double contraction of revenue and revenue
1. Real Economic Value (REV)
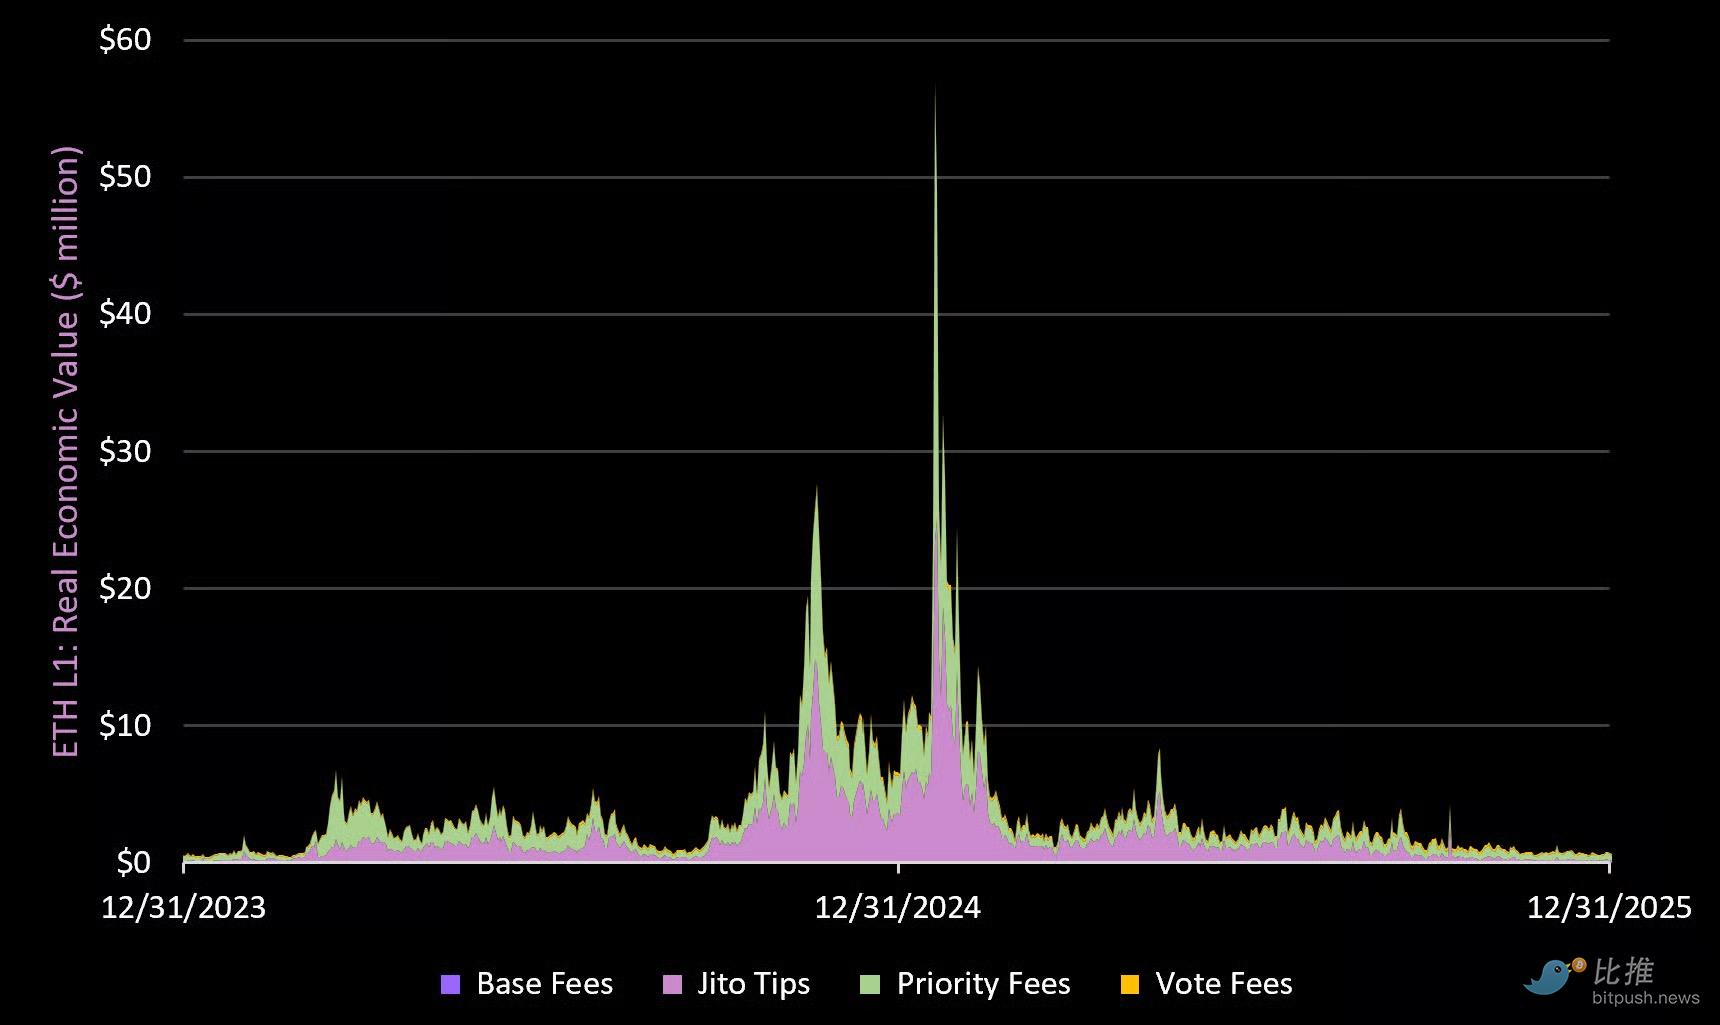
Note: REV includes basic fees, priority fees, MEV (Jito Tips), and voting fees. MEV gives back to SOL holders through staking.
The Solana network generated only $91.1 million in total fees in Q4, the lowest since Q3 2023, and well below the previous quarter's $222.7 million.
2025 full-year performance: Generated $1.4 billion in REV, down 1.4% from last year.
Comparative reference: The Ethereum network's Q4 fees were $141 million, compared to $763 million for the full year of 2025.
数According to the teardown:
Foundation fee: 32% decrease in Q4 (but 43% increase for the full year of 2025)
Jito Tips (MEV): Plummeting 75% in Q4 (up 8% for the full year of 2025)
Priority fees: 51% decrease in Q4 (15% increase for the full year of 2025)
Voting fees: 27% decrease in Q4 (up 32% for the full year of 2025)
Core findings:
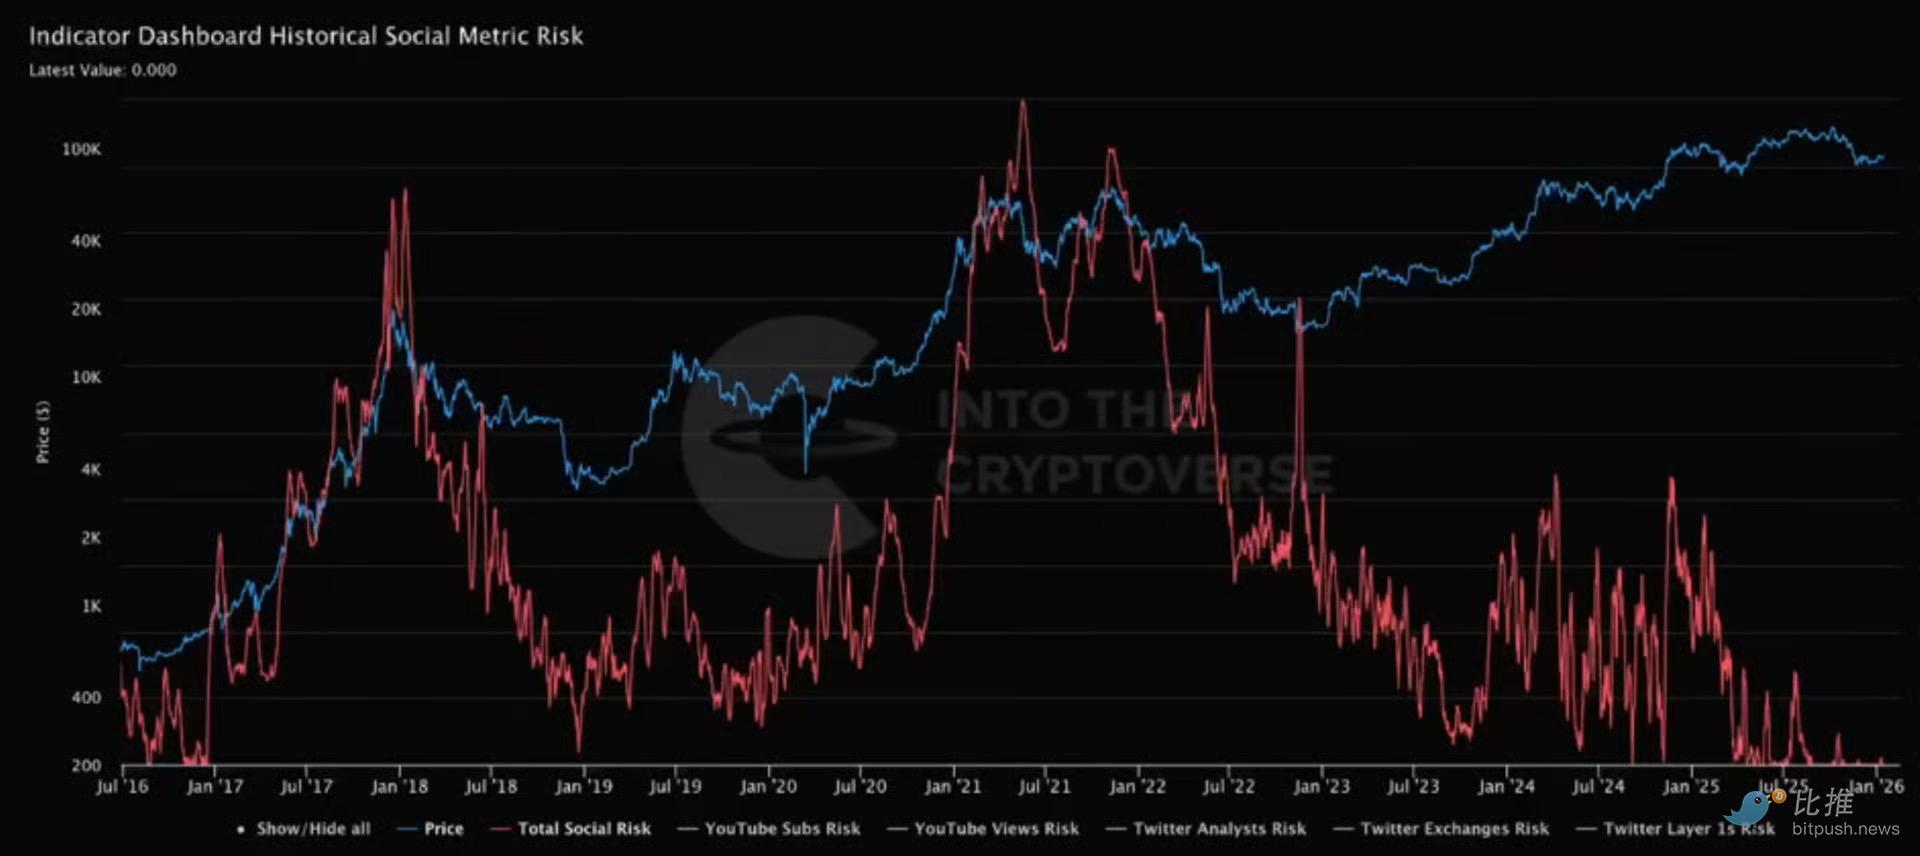
Solana is the current cycle (andHYPERLIQUIDA “base camp for speculation” (together). The most powerful application on the web (Pump,Axiom, Raydium, Jupiter) All cater to retail traders — this makes on-chain revenue extremely cyclical and dependent on speculative demand. With social attention on cryptocurrencies at a six-year low, it's hard to see this trend reversal in the short term.
In the long run, we believe Solana needs to lead the tokenization of on-chain equity (and other RWA) to smooth out the extreme cyclicality of its on-chain user base. Given the recent challenges faced by the Clarity Act, this will still take some time.
2. Real on-chain yield
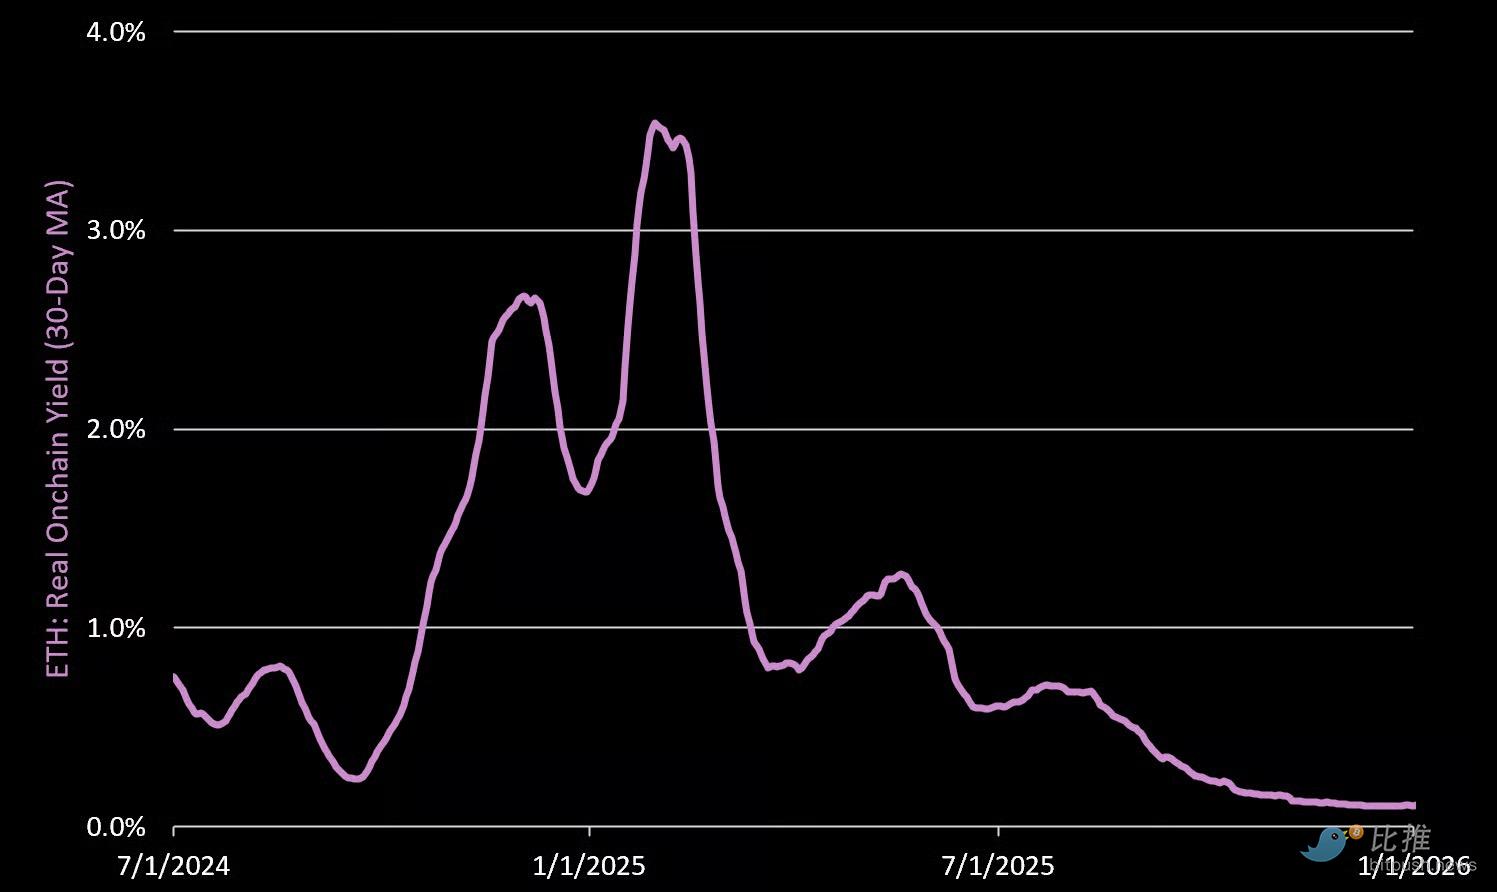
Q4 The real on-chain yield (annualized) was only 0.46%, down 56% from the previous month. Of this, 72% came from priority fees and 28% from MEV. The decline in the share of MEV reflects a significant decline in on-chain competition (that is, speculative demand) this quarter.
3. Total on-chain yield
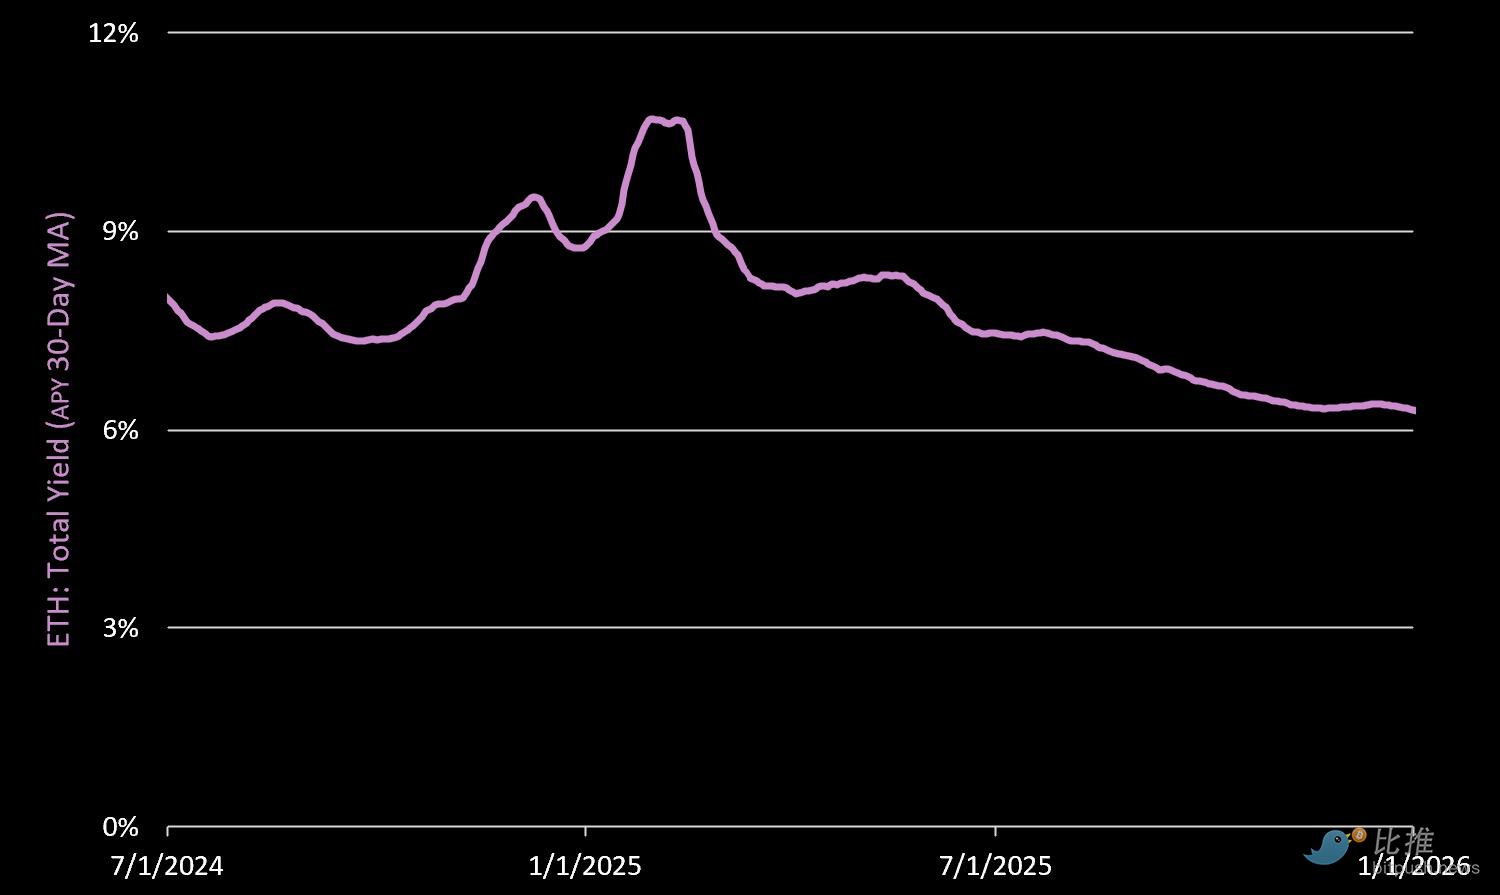
The total annualized rate of return after issuing additional rewards in conjunction with the agreement is 6.7%. Notably, 93% of the proceeds came from SOL's new coin issuance. Overall yield slipped from 7.64% in Q3 due to a 55% drop in priority fees and MEV.
II. Network Fundamentals: The Challenge of Efficiency
1. Monthly network GDP
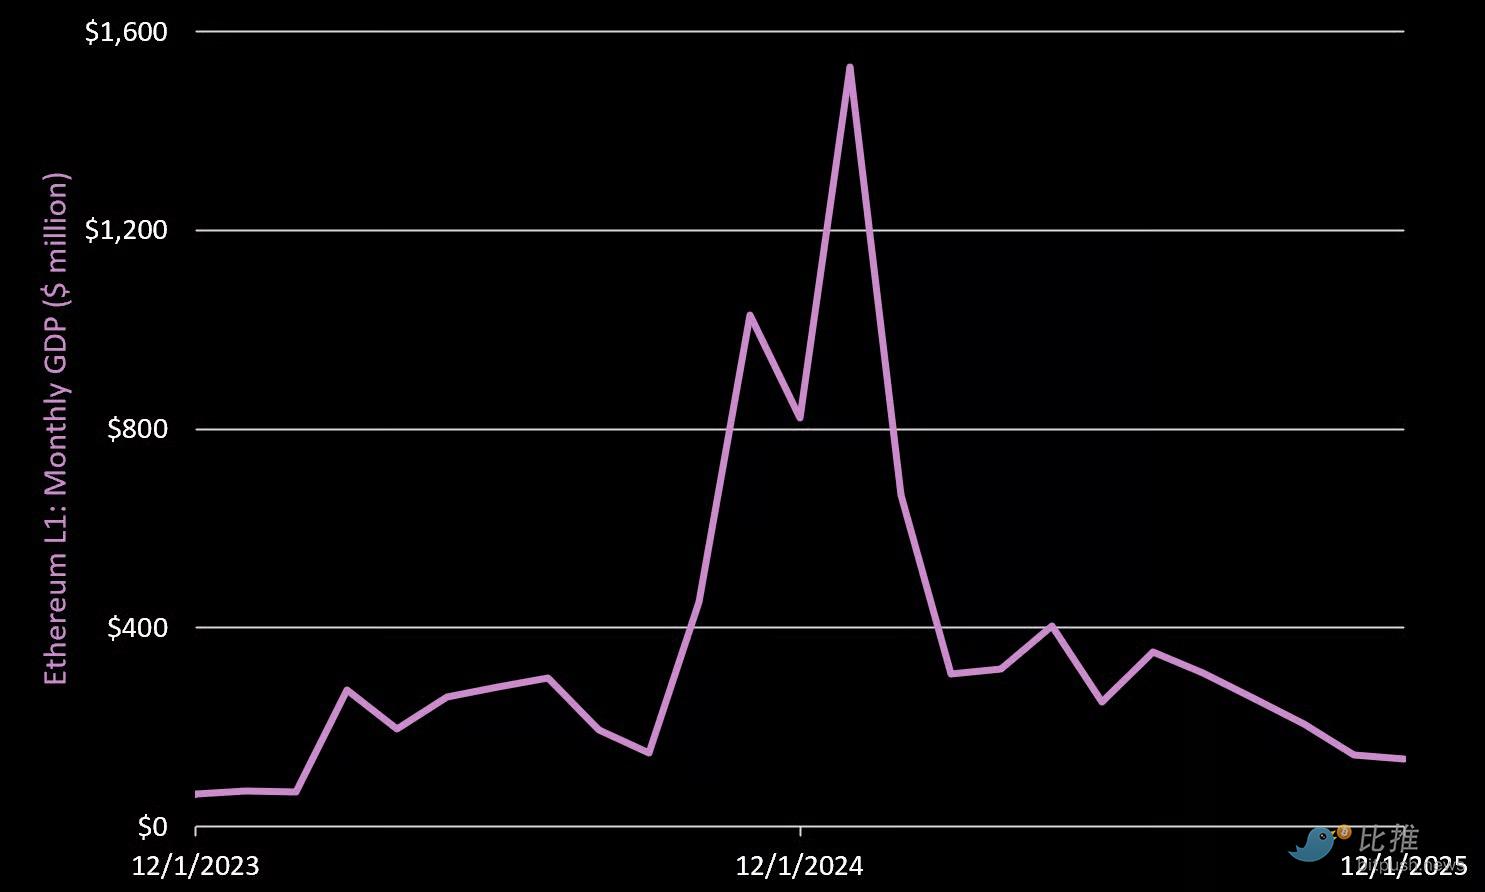
Note: GDP refers to the total cost of the top applications on the chain (not including the cost of the public chain itself).
Q4 Top apps generated $485 million in GDP, down 47% from the previous month.
Pump.fun: $96 million (down 19% in Q4)
Circle: $85 million (up 6% in Q4)
Axiom: $55 million (down 61% in Q4)
Raydium: $31 million (down 79% in Q4)
By contrast, Ethereum L1 applications generated $2.3 billion in GDP in Q4.
2. Active Addresses and Staking
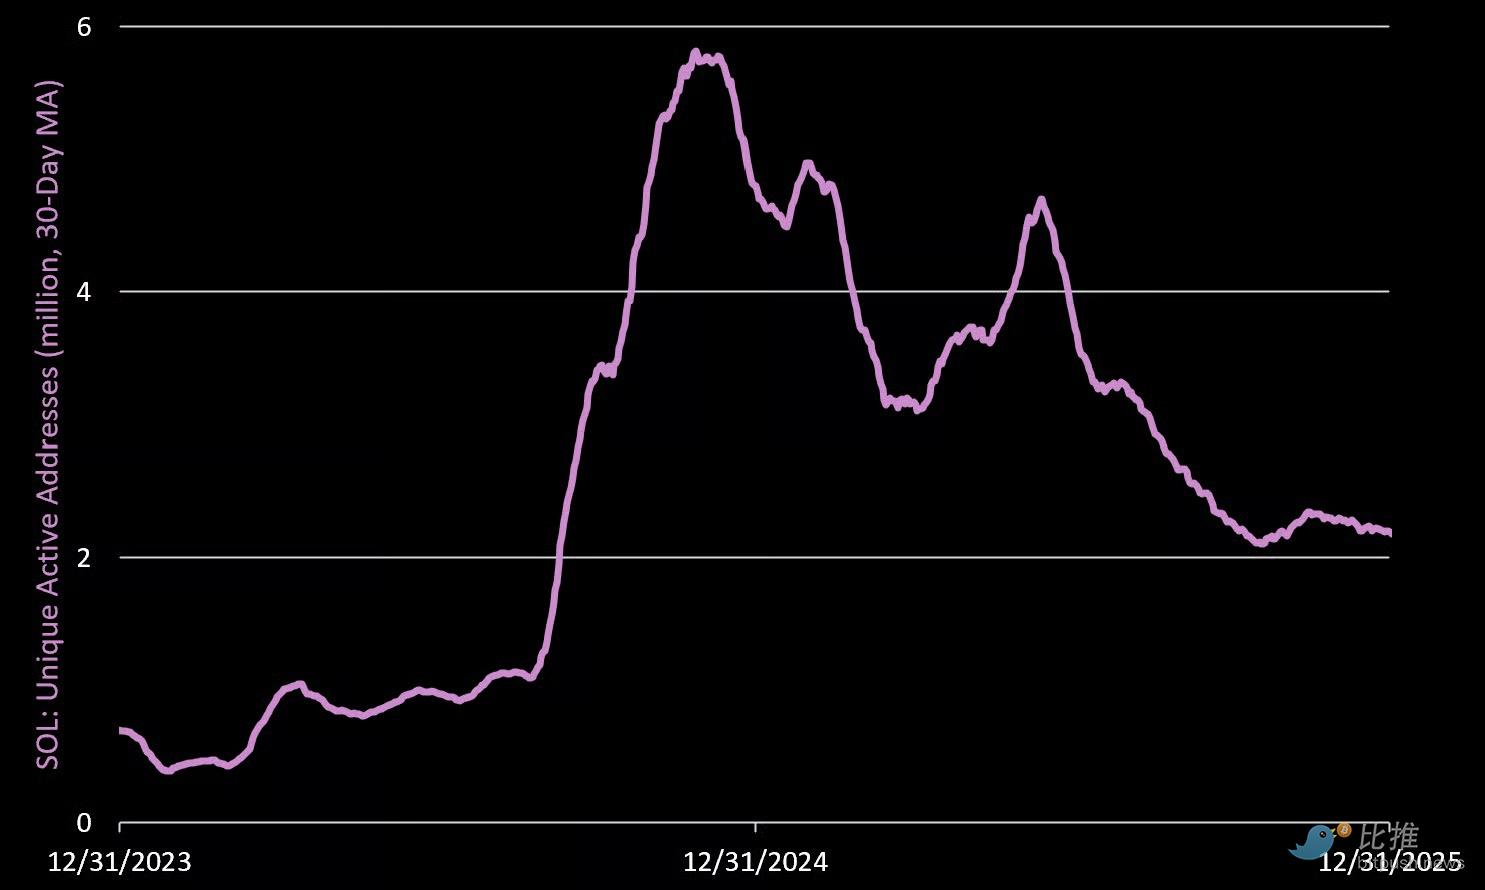
Active addresses: The average number of active addresses per day in Q4 was 2.2 million, a decrease of 19% over the previous month.
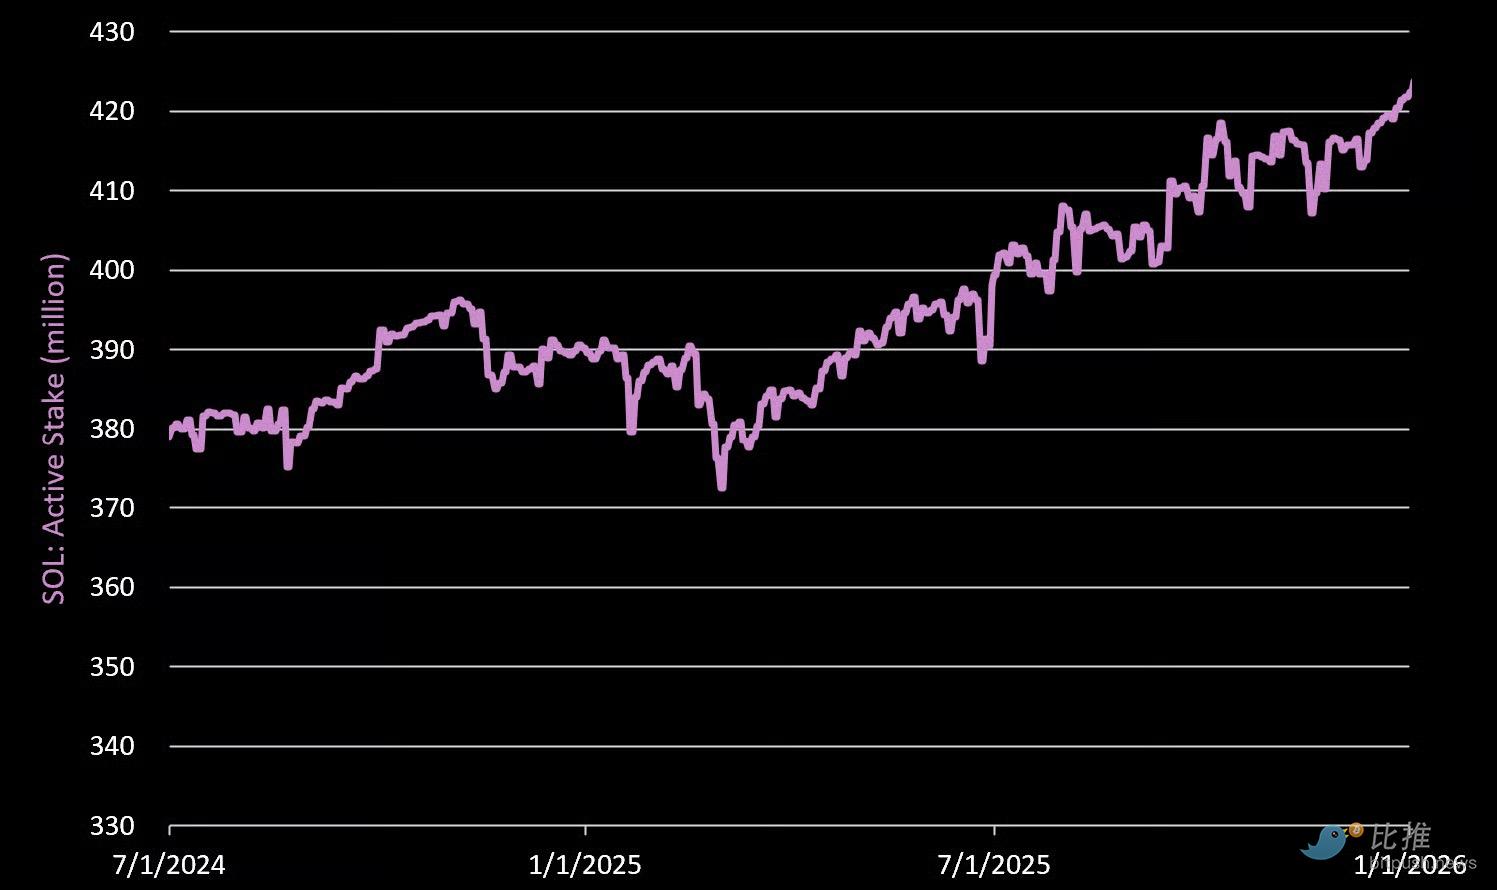
Active staking: As of December 31, 2025, a total of 421.7 million SOL units were pledged (accounting for 75% of circulation), an increase of 3.5% over the previous month.
3. The cost to produce a $1 REV
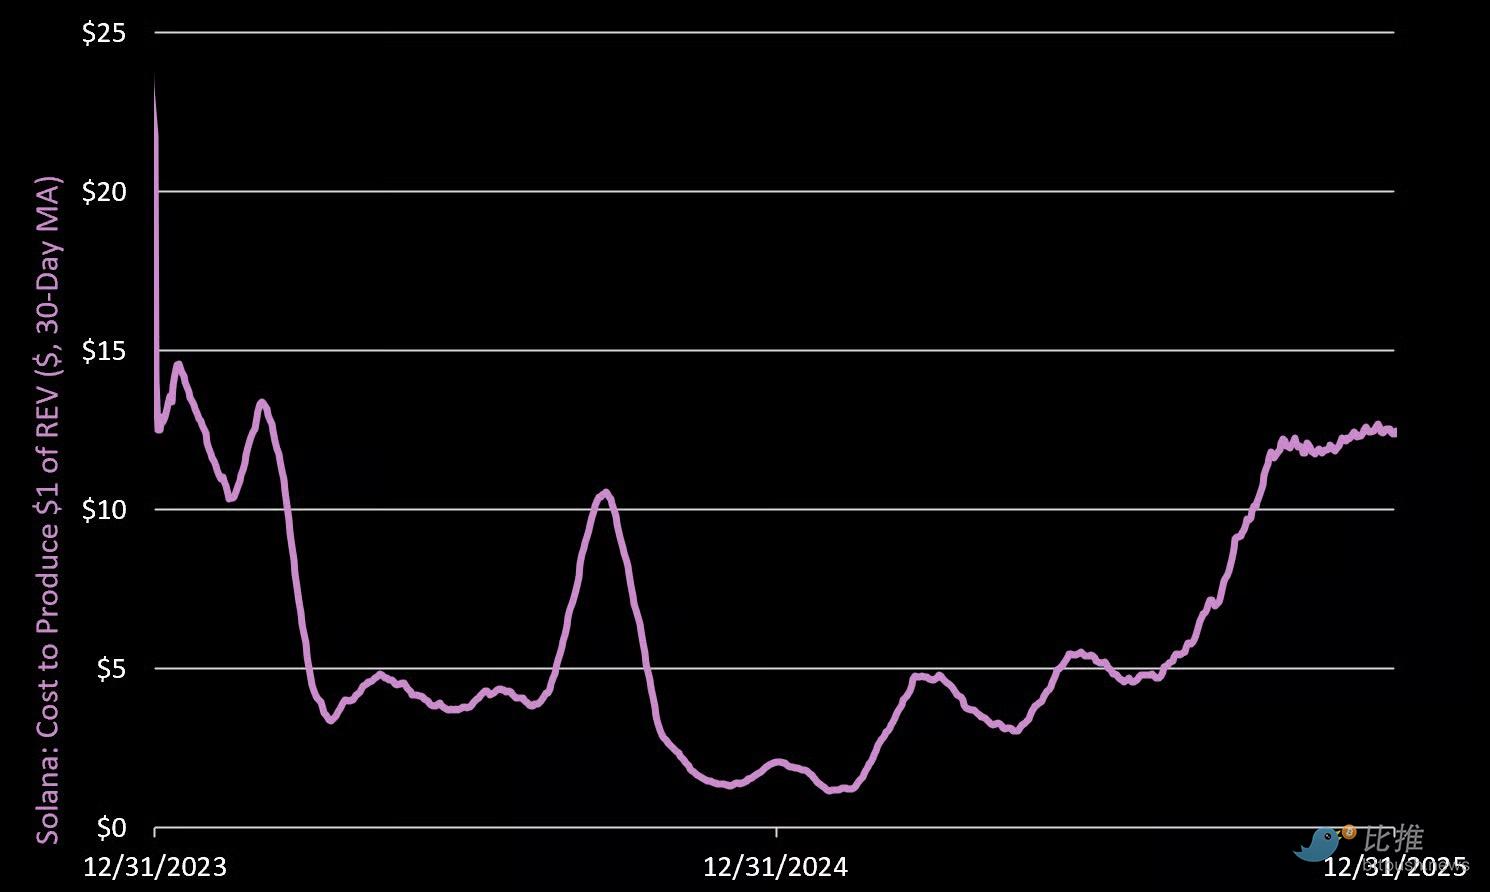
The average cost of generating the real economic value of $1 in Q4 rose to $11.76, a 105% increase over the previous month.
What does this mean? This shows that in order to maintain cybersecurity, the inflationary costs (additional distribution) paid by the network are rising compared to the actual value generated. If you compare Solana to a company, now is the time to cut management costs and cut expenses.
3. Stablecoins
Stablecoin supply
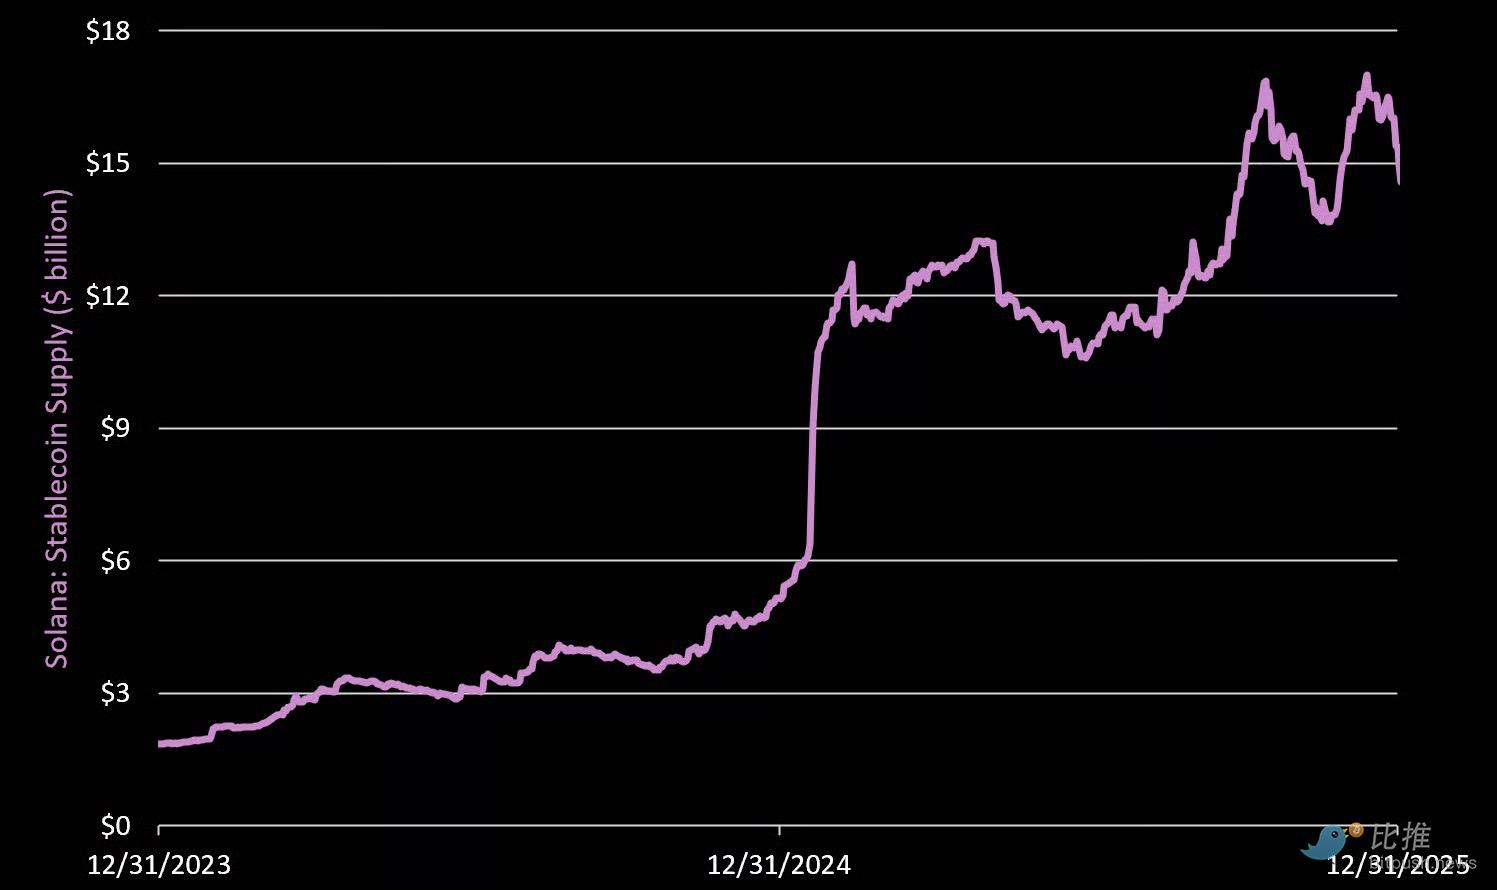
The total amount of on-chain stablecoins reached $15.4 billion, up 4.4% from month to month. This accounts for 5% of the total supply of stablecoins in the crypto market, ranked by Ethereum,Tronand after BNB. Head issuer:
Circle/USDC: $9.9 billion (down 1% in Q4)
Tether/USDT: $2.1 billion (down 10% in Q4)
Paypal/USDPY: $870 million (up 95% in Q4)
Paxos/USDG: $870 million (up 80% in Q4)
Solstice/USX: $306 million (up 83% in Q4)
Effective stablecoin turnover
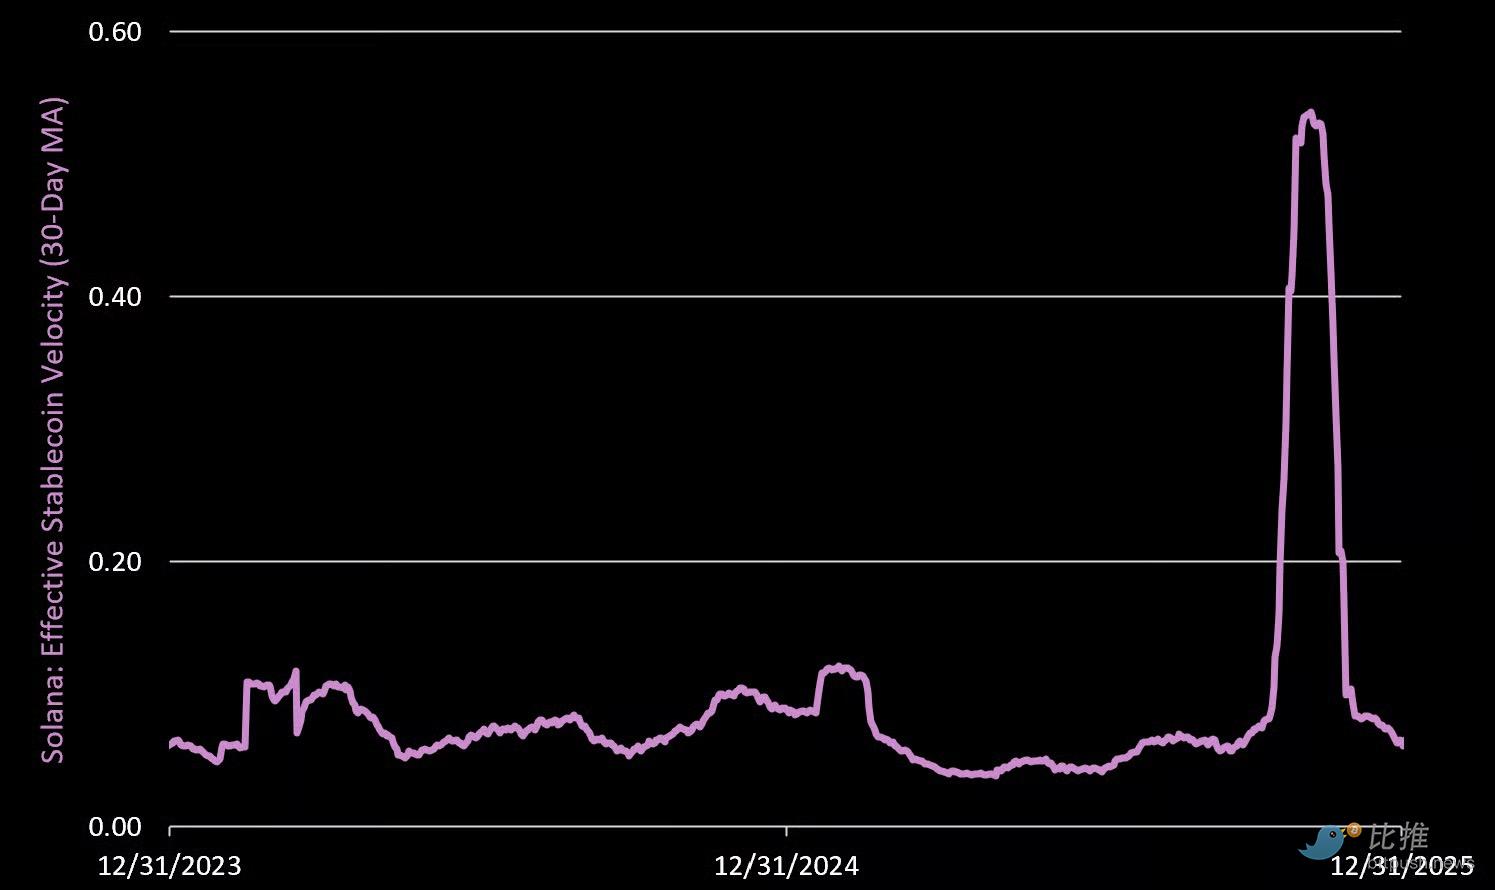
Effective stablecoin turnover measures the daily turnover rate per dollar stablecoin on the chain. The indicator filters the noise of volume transactions and circular transactions. The measurement formula is: daily net dollar transfer amount/circulating supply. An increase in value indicates an increase in economic activity.
The average turnover in Q4 was 0.22, an increase of 282% over the previous month. However, this increase is largely due to the sharp fluctuations that occurred during the 10/10 liquidation event.
The 0.22 reading means that 22% of the stablecoin supply rotated during the quarter. For reference, Ethereum's L1 Q4 turnover rate is 3%, while Ethereum's L2 overall turnover rate is 5%.
Net Dilution Rate
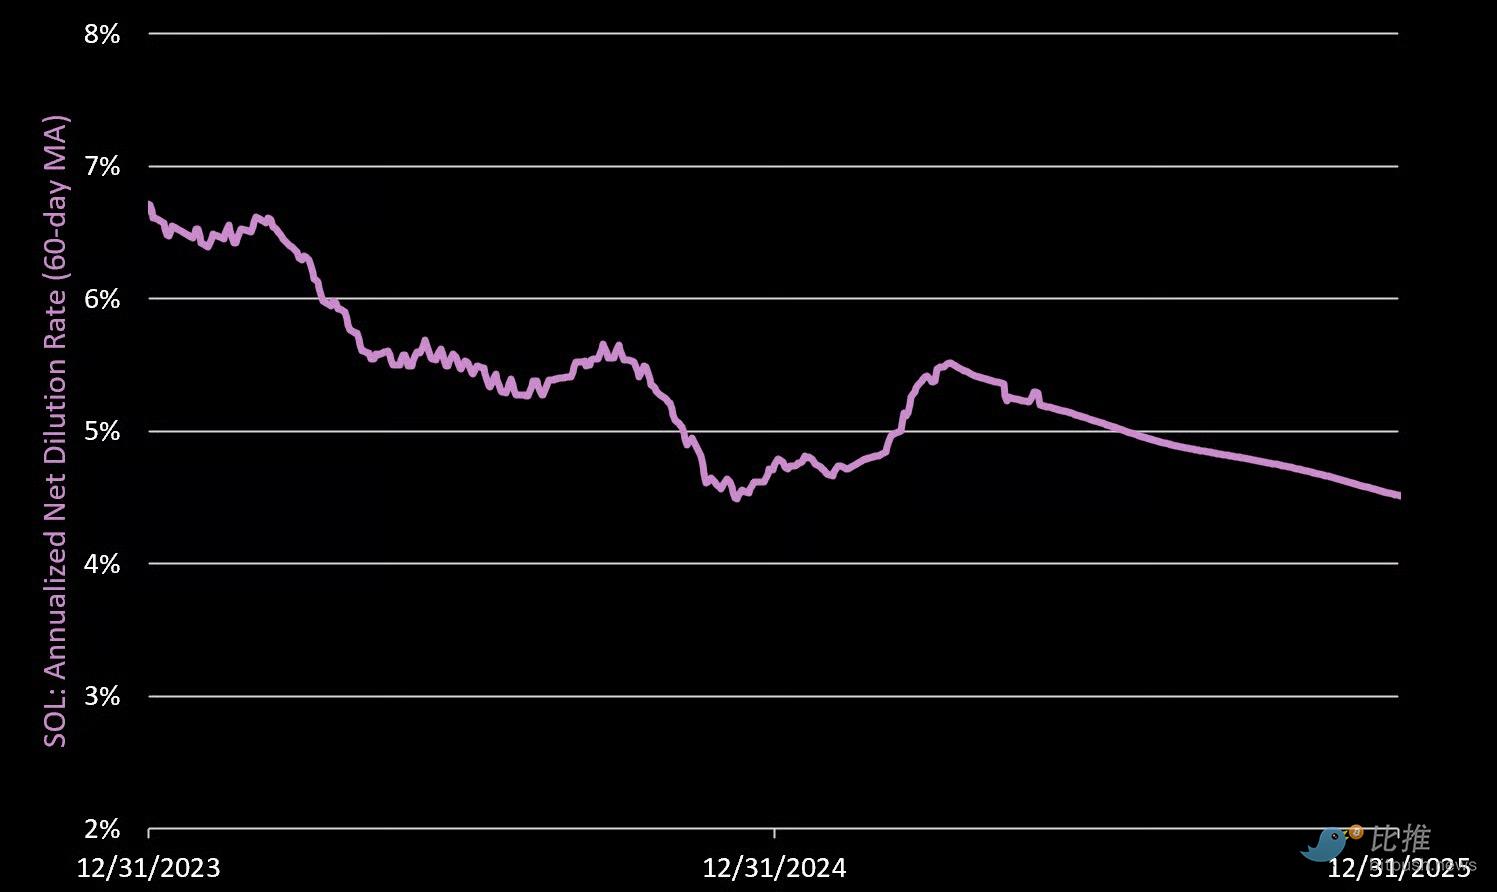
Net dilution rate = daily agreed additional volume minus destroyed SOL/circulating supply (annualized). Positive values represent dilutions for non-pledged SOL holders.
The Q4 annual net dilution rate was 4.57%, a decrease of 5.5% month-on-month. Drivers:
Additional SOL issuance: 6.45 million in Q4 (6.8 million in Q3)
SOL destroyed: 63,764 in Q4 (76,247 in Q3)
Net results: Net increase of 6.38 million SOL in Q4 (4.57% annualized inflation rate)
4. DeFi: The rise of private DEXs
DEX trading volume
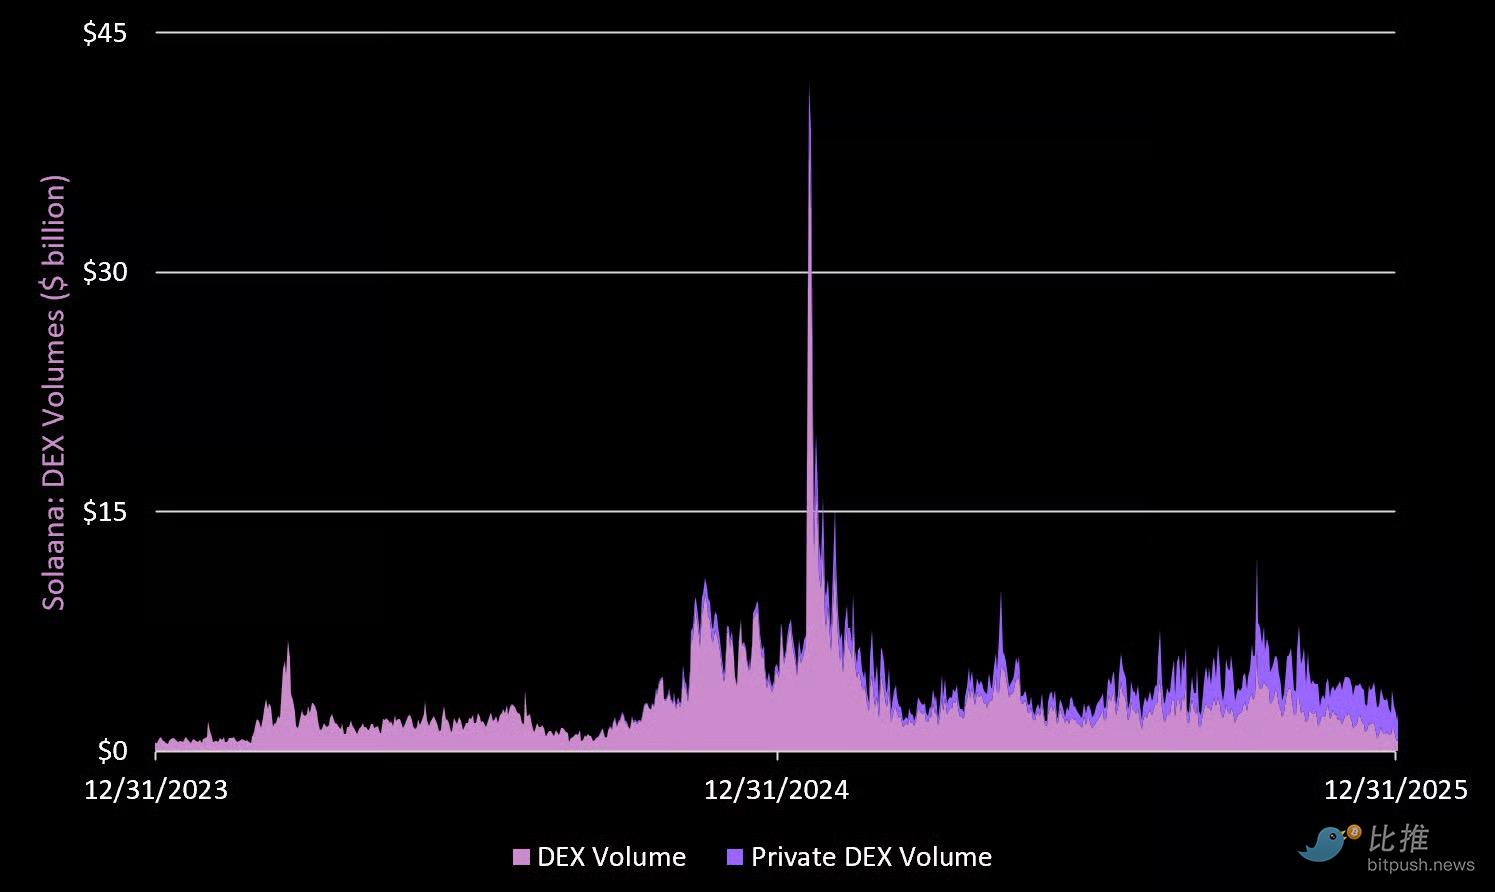
Private DEXs on Solana have seen tremendous growth. The average daily trading volume was $2.2 billion (48% of total volume), up 50% from month to month.
Meanwhile, the average daily trading volume of public DEX Q3 was $2.5 billion, up 5% month-on-month. Taken together, total DEX trading volume increased 15% this quarter. The DEX with the highest trading volume:
HumiFi (private): $1.4 billion per day (up 105% in Q4)
Raydium: $985 million/day (up 6% in Q4)
Meteora: $700 million/day (up 27% in Q4)
Orca: $473 million/day (down 24%)
Tessera(Private): $303 million/day (up 57% in Q4)
Pump Fun: $88 million/day (down 24% in Q4)
DeFi Turnover Rate (DeFi Velocity)
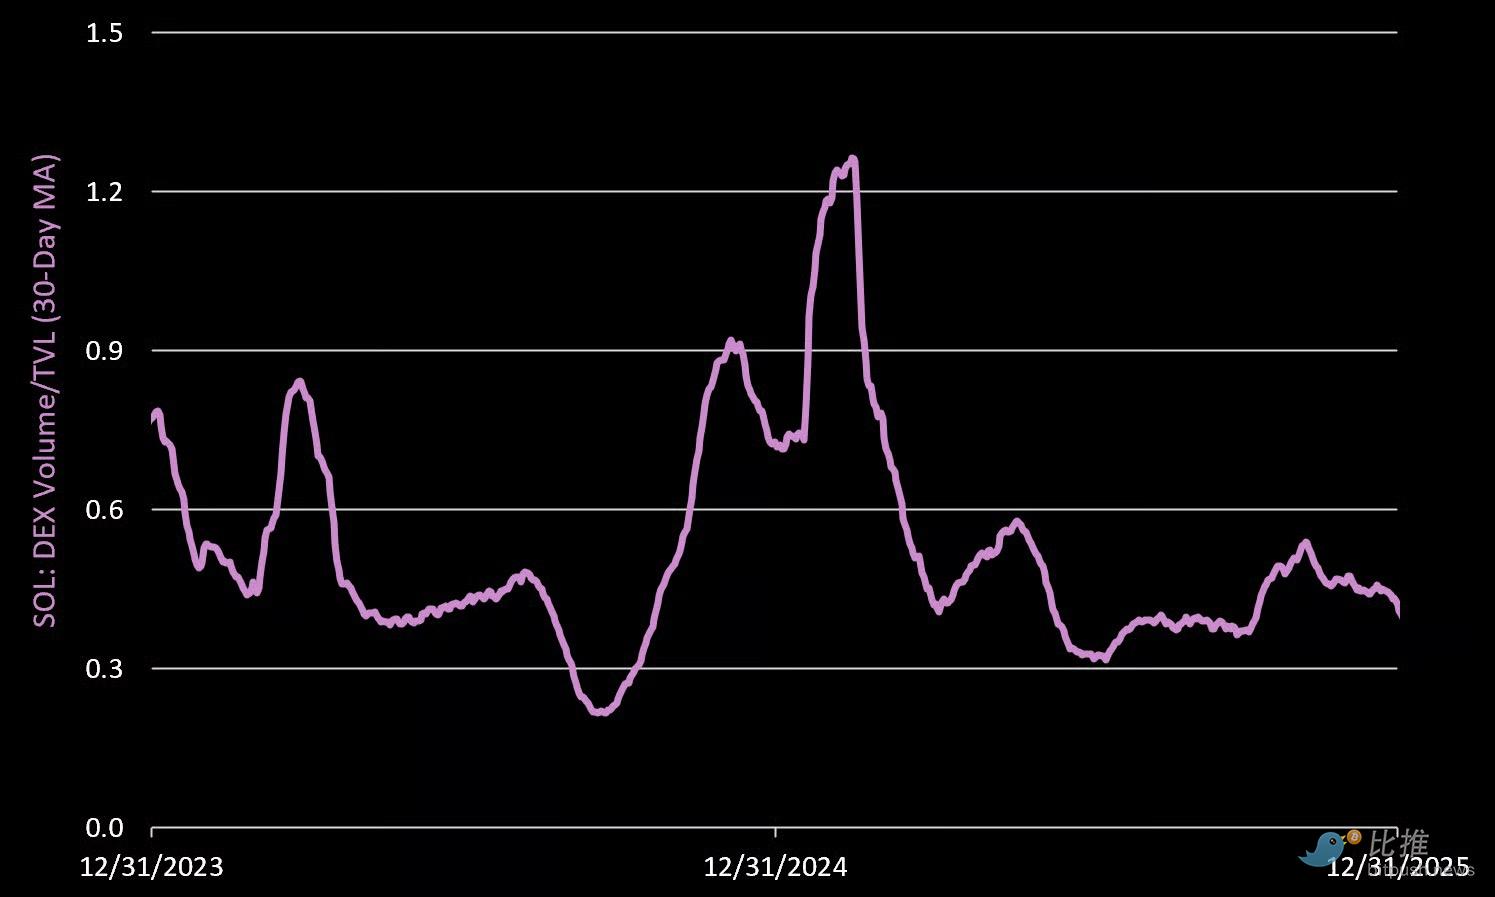
Measure the turnover rate per dollar within a DeFi protocol. The Q4 indicator rose 22%, and the average daily turnover rate was 46% of TVL. Much of the activity was due to extreme fluctuations in the 10/10 liquidation event.
Add transaction tokens
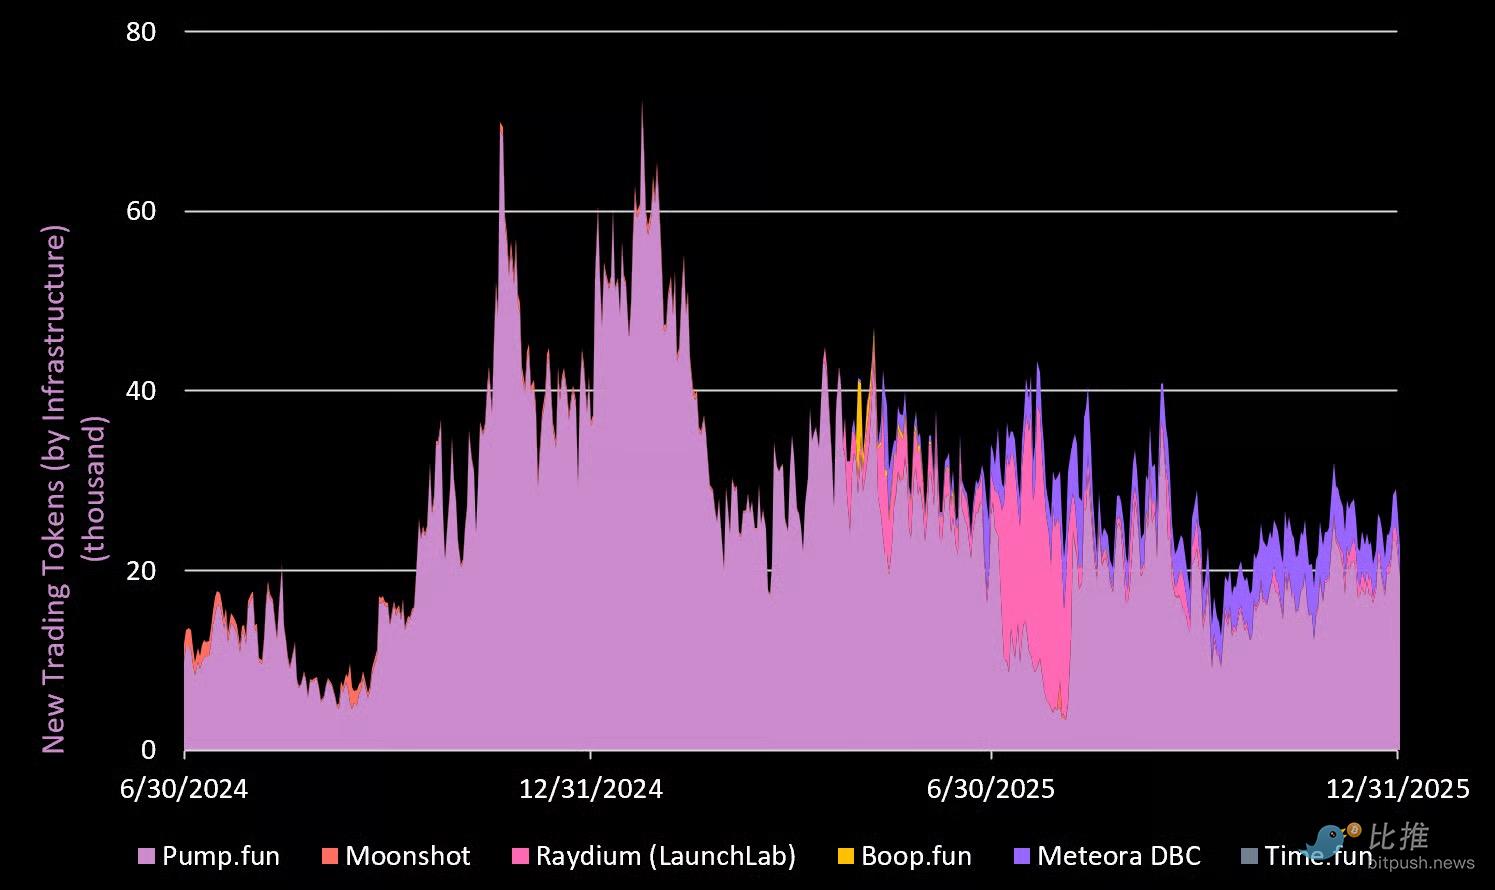 Q4 was created on the Solana launch platform2.1 millionThe token declined by 24% month-on-month.
Pump FunContinues to lead with SGD 1.6 million (75% market share).
MeteoraIt was the highlight of Q4, growing 18% and accounting for 21% of the share.
5. Fair value
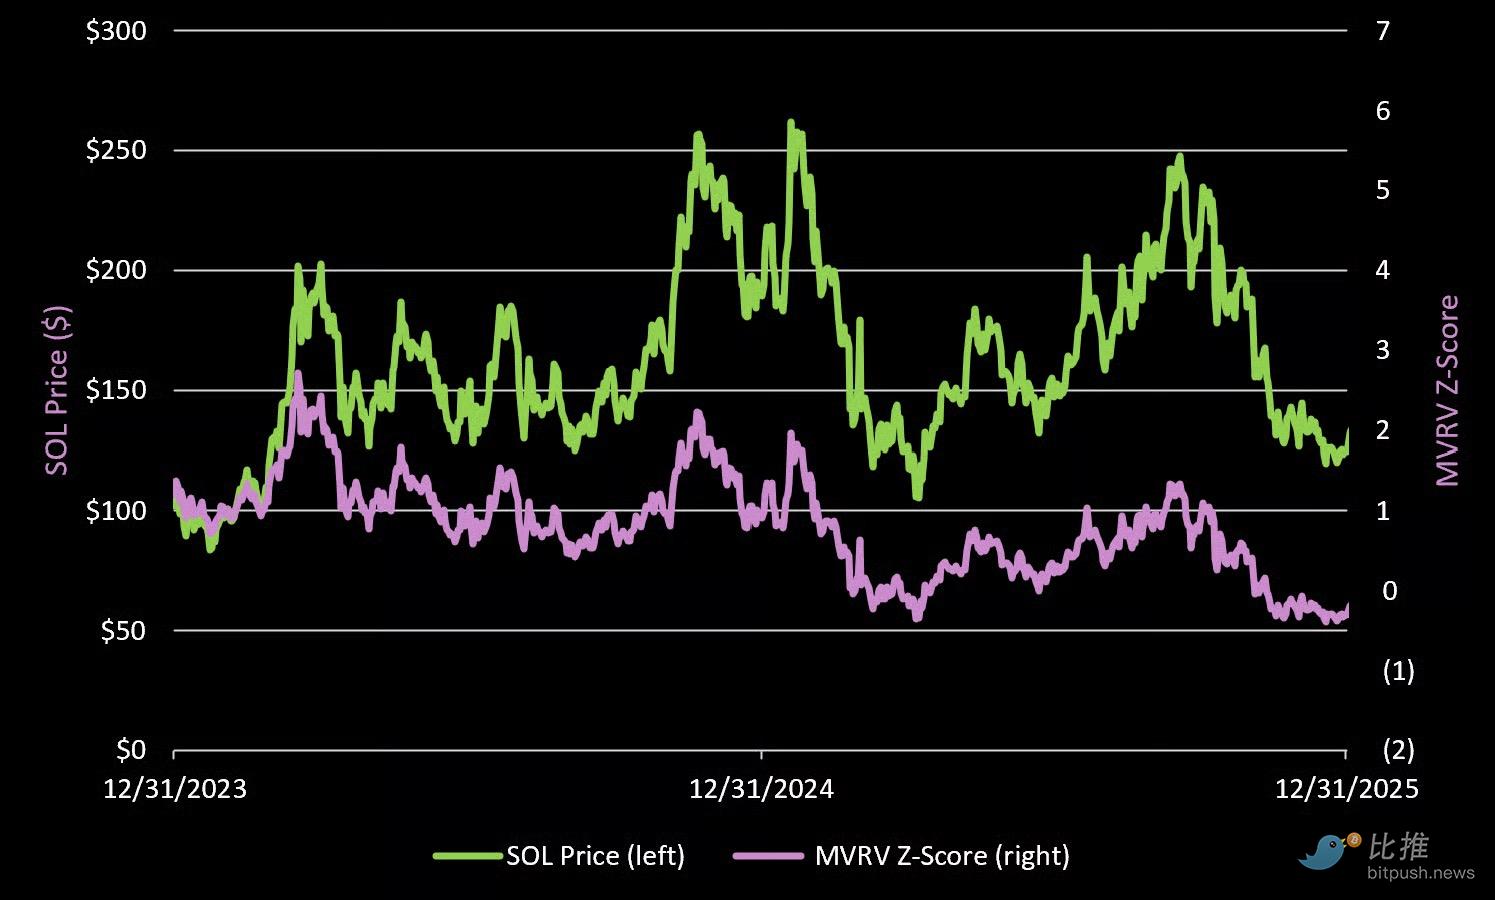
From a valuation perspective, SOL's current MVRV is 0.95, which means its price is lower than the realized price (about $145).
In terms of “fair value,” SOL is currently trading below its realized price of $145 (an alternative measure of the cost of holding all tokens on the network), and MVRV is 0.95. At the bottom of the 22-year bear market, SOL fell to 22% of the realized price.
Although we don't expect this cycle to happen again, we do think SOL will be significantly lower than the realized price at some point, and the target range is$90 - $110between.
200-week moving average
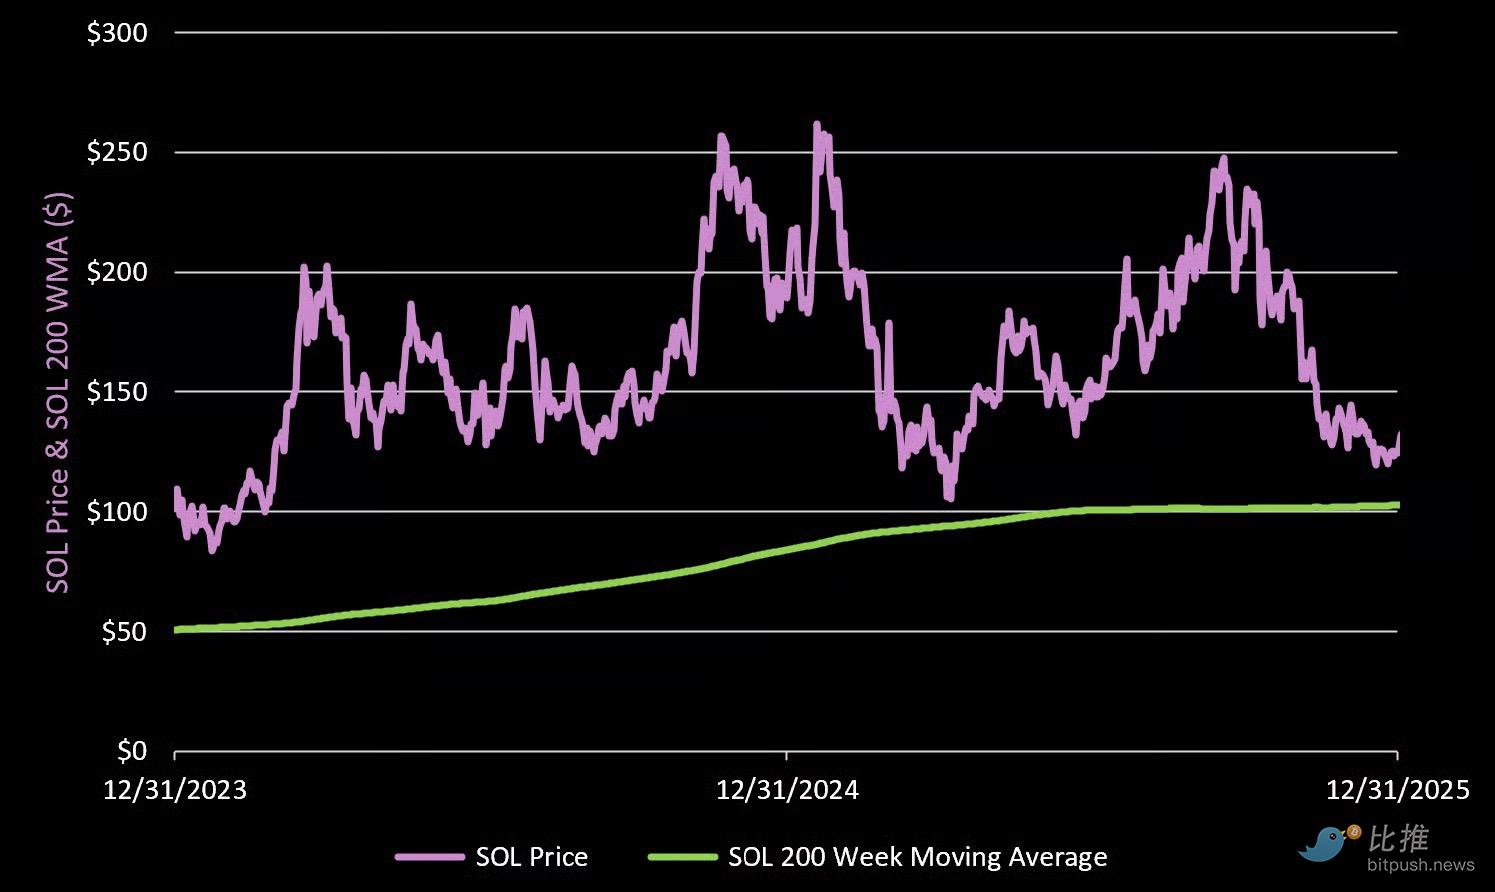
We also expect SOL toAt some point, backtest the long-term 200-week EMA,This value is currentlyfor $103。
6. Conclusion: Three keys to getting back to the top
Solana has gone through its darkest hour at the end of 2022, proving that it has not only survived, but is stronger than ever before. But to continue to mature, it must complete the following three points:
Dig deeper into consumer/retail transactions: Don't mention “chain games”; the most real “game” of cryptocurrencies currently is retail transactions. Solana needs to innovate in protecting users from sniping attacks and cracking down on “chopping chives” projects.
Embrace TradFi: Since the goal is a “Nasdaq on the blockchain,” real stock and bond assets are needed.
Win the battle of developers: Continue to export resources to developers around the world and maintain a leading edge in technology iteration.
We bought Solana in reverse at the end of 2022/early 2023, established a core position at a cost of $15.39, and exited at the end of 24/25 with a profit of 10 times more. Now we are patiently waiting for the next “perfect hit point.”
Disclaimer: The above only represents the author's personal opinion and does not constitute investment advice.
Twitter:https://twitter.com/BitpushNewsCN
Compare the TG exchange group:https://t.me/BitPushCommunity
Compare TG subscriptions:https://t.me/bitpush
