


I'm “hiding” from the bull market in the coin industry. Where is the bottom of Bitcoin?


Open the market software, and on the left is NASDAQ — another record high. On the right is Bitcoin — it's falling again.
This sense of division is probably the collective experience of people in the cryptocurrency industry in 2026.
Other people count money in AI, and we “hide” the bull market in the coin industry.
In the past 24 hours, Bitcoin dropped to $66,359, then rebounded slightly to around $67,000, down 6% in a single day. Since hitting an all-time high of $126,198 in October last year, Bitcoin has accumulated a cumulative retracement of more than 46%, and the lengthy correction continues.
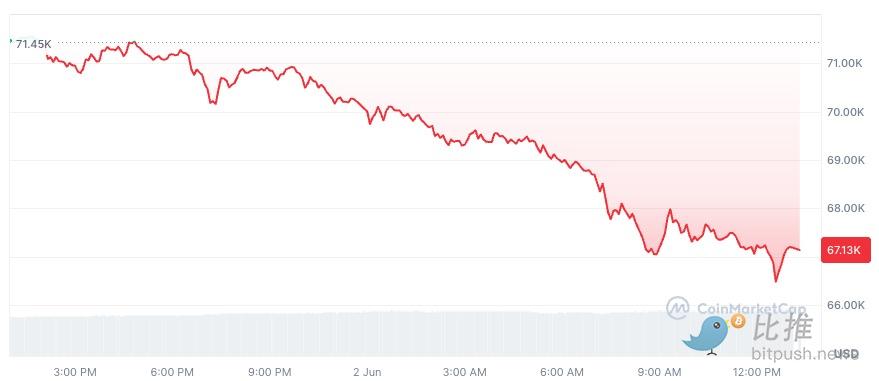
At the same time, there is no breathing room at the macro level: stubborn inflationary pressure, the Federal Reserve's lack of interest rate cuts, and geopolitical tension between the US and Iran continues to disrupt risky assets. Coupled with the crazy amount of money drawn by US AI tech stocks in the NASDAQ and S&P 500, it has eaten up the liquidity of risky assets flowing into the crypto market. Between a more definitive AI narrative and a highly volatile digital asset, the capital resolutely chose the former. Affected by this, US spot ETFs experienced a huge withdrawal of 2.43 billion US dollars in May, directly reversing the previous inflow trend.
In this context, where exactly is the bottom of Bitcoin?
According to the latest data from prediction market Myriad, the probability of traders betting on Bitcoin falling to $55,000 has risen to 58%.
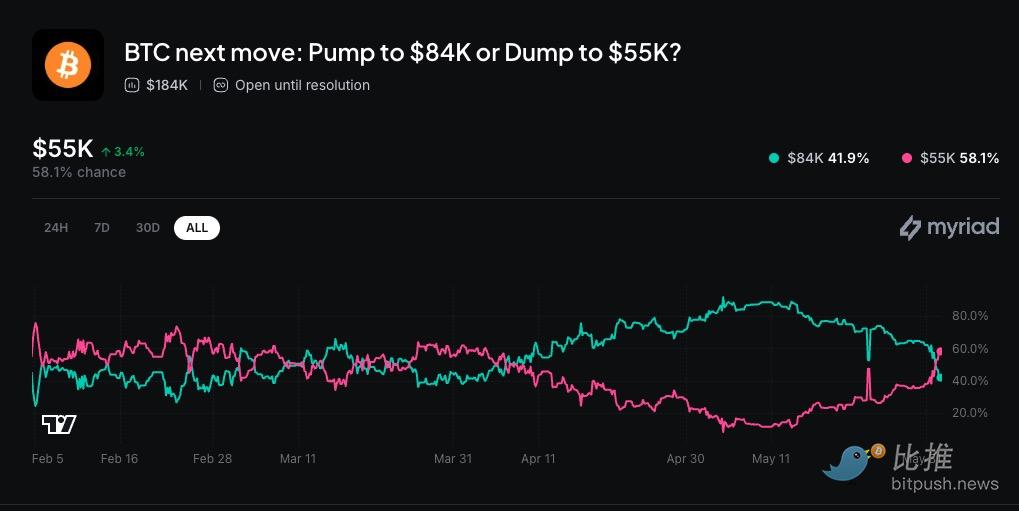
This article synthesizes the opinions of various analysts. The market's potential bottom expectations for Bitcoin can be broadly divided into three major camps.
Optimists: $60,000 - $64,000 partial bottom
This faction mainly relies on the radicalization of short-term technical indicators and historical partial support levels, believing that market sentiment is already excessively pessimistic.
Technical logic: The current daily RSI has fallen to the extreme oversold region of 22.7. Judging from history, overselling at such a depth has often triggered a brief “dead cat jump” rebound.
Analyst Views:
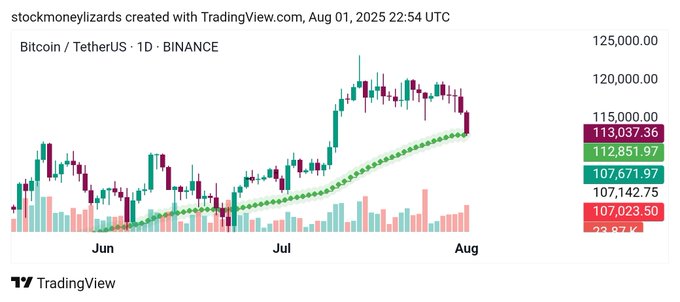
Stockmoney LizardsIt was pointed out that the market is currently in a perfect partial bottom position, and the oversold indicator, along with long-term EMA testing, may usher in technical repair at any time.
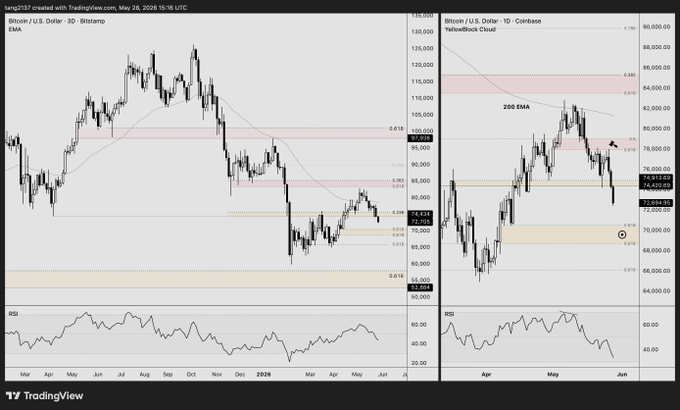
Diego TradesIt is believed that $63,000 - $64,000 is currently the largest core support area. If we see a strong right-side buying intervention here, this will be the phased bottom of this round of correction.
TANGIt is also believed that after breaking the $69,000-$70,000 level, a large bottom consolidation zone will form near the lower 60,000 integer mark.
Rational pessimists: $46,000 — $55,000 structural damage
This faction believes that the lack of macro-liquidity and the breakdown in technology patterns mean that Bitcoin needs a deeper pullback to clean up leverage.
Technical dead end and trend confirmation: The 50-day EMA has now fallen below the 200-day EMA, forming a long-term bearish “death cross”. Meanwhile, ADX, which measures the strength of the trend, is at a high of 30.6, indicating that the current downtrend has extremely high bearish momentum.
Macro capital outflow: The net outflow of US Bitcoin spot ETFs reached US$2.43 billion in May. Traditional capital is being withdrawn from risky assets against the backdrop of the Federal Reserve's refusal to cut interest rates, stubborn inflation, and the AI racetrack being strongly attracted to money.
Analyst Views:
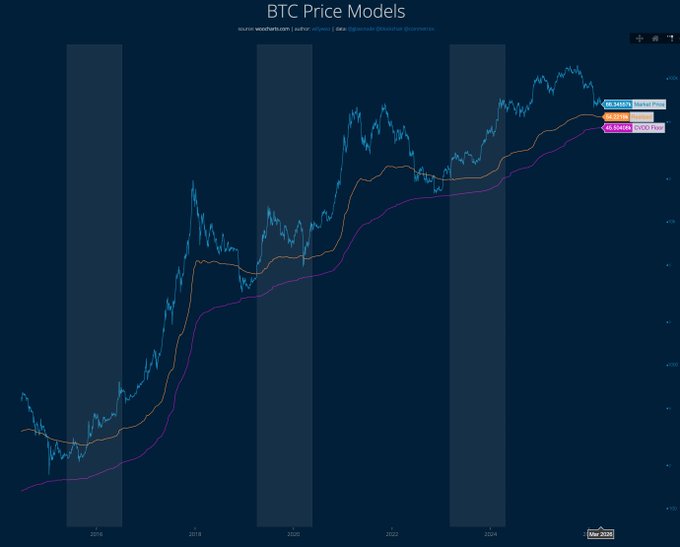
On-chain data expertsWilly WooAccording to its old on-chain model and CVDD Floor (bottom value of cumulative days of destruction) model, the actual bottom of the current chain of BTC is roughly in the $46,000 - $54,000 range (the bottom of the current CVDD model is about $45.5k). This is highly consistent with the forecast market's speculation of a bottom of $55,000.
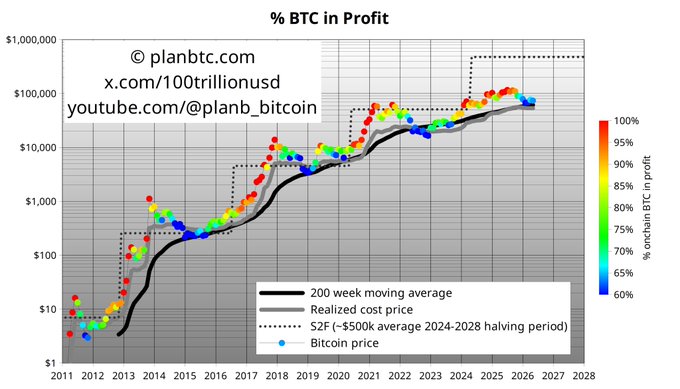
Inventor of the S2F modelPlanB displayCurrently, the market is in a 50/50 dispute over “whether February's $60,000 is the bottom”. Judging from data such as the share of profitable addresses on the chain, the actual bottom pattern has not yet been established. There is a 50% probability that the market will continue to break down, backtest $61,000 where the 200-week moving average (200WMA) is located, and even hit the realized price ($53,000) representing the overall market cost line.
TedIt is proposed that currently the bottom of Bitcoin's electricity production cost is less than $49,000. Although ETF outflows from institutions such as BlackRock have accelerated the panic, falling below the production cost line often means that absolute value bottoms are approaching.
Extreme bear market: $32,000 - $44,000 cyclically bottomed out, no supercycle
This faction believes that the adjustment from the end of 2025 to 2026 is not a simple “bull market retreat”, but has entered a standard cyclical bear market, and the price needs to return to a lower benchmark level.
Crypto Tice“The real bottom is yet to come,” he said. The bottom of the market needs to be confirmed along with retail investors' fears and volume bursts; the current market decline process is silent and insignificant, indicating that the downturn is far from over.”
BlockVortex NGIt is clearly stated that the so-called “supercycle” has broken, and the final bottom window for the 2026 bear market is expected to arrive in October, when the bottom price will fall between $36,000 and $50,000.
Looking at these three schools of opinion together, the bottom of Bitcoin is actually not a specific number, but rather a line of defense where “emotion → cost → cycle” recedes layer by layer.
First line of defense: $60,000 - $64,000.
This is where the technocrats want to fight back by “falling too far” (RSI is only 22.7). But the problem is that even with the historic level of support of $61,000 (200-week EMA), PlanB said it — the win rate was just five or five.
Second line of defense: $46,000 — 55,000.
This is the area where consensus is currently highest. The forecast market is betting $55,000, PlanB's cost model points to $53,000, and Willy Woo's on-chain data is between $46,000 and $54,000. The three lines intersect here, which is currently the most “solid” bottom section.
Third line of defense: $36,000 - $44,000.
This is the “bottom line” of the historical cycle. If ETF funds continue to run and the market continues to panic and cut meat, then the price can only be forced into this region to complete the actual clearance.
Simply put: falling fast ≠ falling finished. Right now, the dead fork is under pressure, and the trend is still going down. We can see a short-term rebound, but if we really want to break the bottom, we also need to be prepared to go to a lower position.
(The data in this article is as of 17:00 EST on June 2, 2026)
Author: Bootly
Twitter:https://twitter.com/BitpushNewsCN
Compare the TG exchange group:https://t.me/BitPushCommunity
Compare TG subscriptions:https://t.me/bitpush
