


Chip stocks then crashed, and Bitcoin held up

Wall Street closed on Tuesday, and the memory chip sector continued to be bloodwashed.
The Dow initially closed down 0.25%, the S&P 500 fell 0.45%, and the NASDAQ fell 1.16%. The retracement of memory chip stocks increased — SanDisk (SNDK.O) fell 7%, Western Digital (WDC.O) fell nearly 8%, Micron Technology (MU.O) fell 4.7%, and SpaceX (SPCX.O) fell nearly 7%.
Bitcoin fell slightly after hitting a two-week high of $64,597 during the intraday period, and eventually stabilized above $63,500.
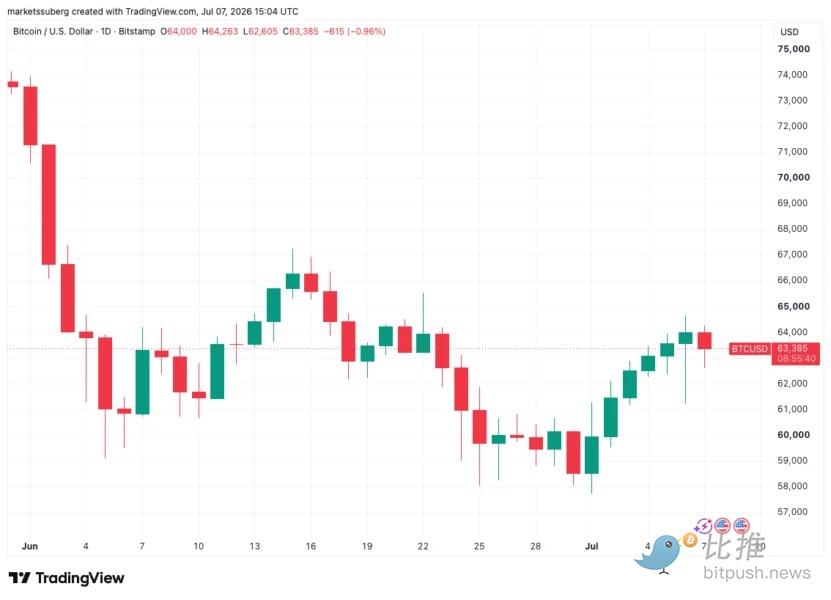
On a trading day when the NASDAQ fell more than 1% and the chip sector collectively failed, Bitcoin's decline was far less than that of technology stocks — once again emerging from a “relatively independent” market.
The truth about the short-term rebound: bears are dominant in making up
What exactly is the driving force behind this round of rebound?
On-chain data shows that Bitcoin futures open positions (OI) have dropped from a high of 776,000 BTC on July 3 to 740,000 BTC, indicating that derivatives traders did not participate in this round of growth. Meanwhile, Coinbase's premium continues to be negative, indicating that US investors' demand for spot purchases is still weak.
In other words, this rally was more the result of a bearish squeeze — rather than fresh bulls entering the market.
“Until BlackRock's IBIT shows continued structural institutional demand, this level of support has not been confirmed,” Bitfinex analysts said in a report.
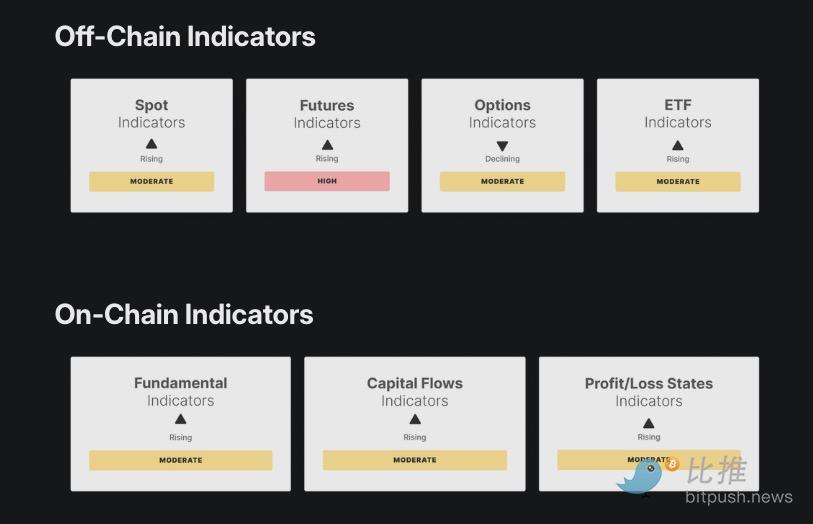
The Glassnode market report also indicates that the current market currency trading volume is still sluggish, while the amount of unclosed contracts and long funding rates have increased.
ETF funding side: trend unconfirmed
One point that also needs to be observed is the shift in ETF capital flows.
On Monday (July 6), the US Spot Bitcoin ETF recorded a net inflow of $265.7 million, the largest single-day net inflow since May. Of this, BlackRock's IBIT contributed $209.4 million. Other products include Fidelity's FBTC inflow of $9.7 million, ARK 21Shares' ARKB's inflow of $33 million, and Grayscale Bitcoin MiniTrust's inflow of $42.3 million — only Grayscale's flagship product, GBTC, continued to flow out $44.5 million.
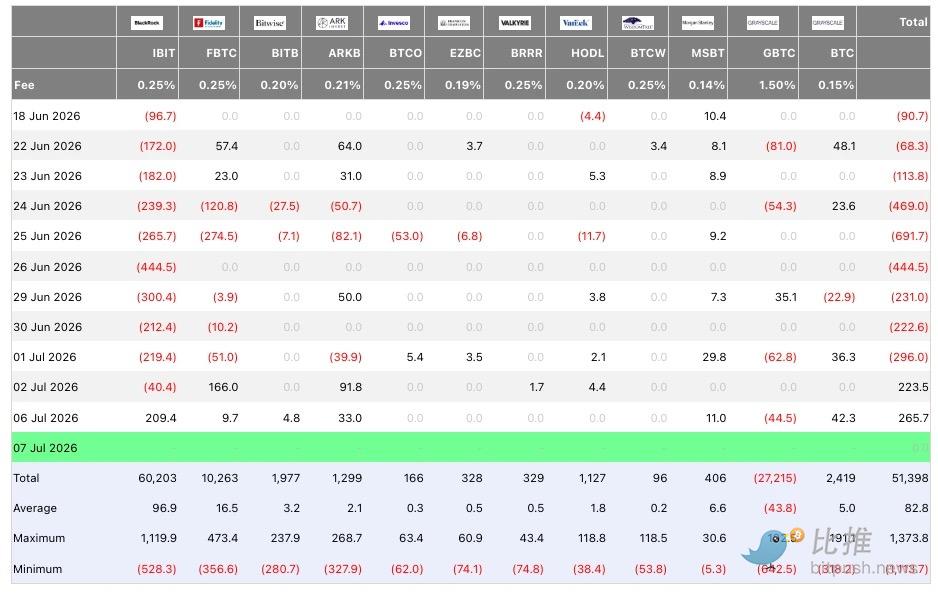
This was the second straight day of positive inflows. Prior to that, US spot Bitcoin ETFs experienced eight consecutive weeks of net outflows. Meanwhile, in June, the ETF had a record net outflow of around $4.5 billion.
However, one data is alarming: for the week ending July 4, despite two days of inflows, the weekly net outflow still reached $526.6 million, a record for the eighth consecutive week of net outflow. The current stage is still a “repair observation window” rather than a “confirmed turning point.”
Micro Strategy Coin Sale: The timing is not very friendly to the bulls
Strategy (MicroStrategy) sold 3,588 BTC last week to cash out approximately $216 million to pay dividends on preferred shares.
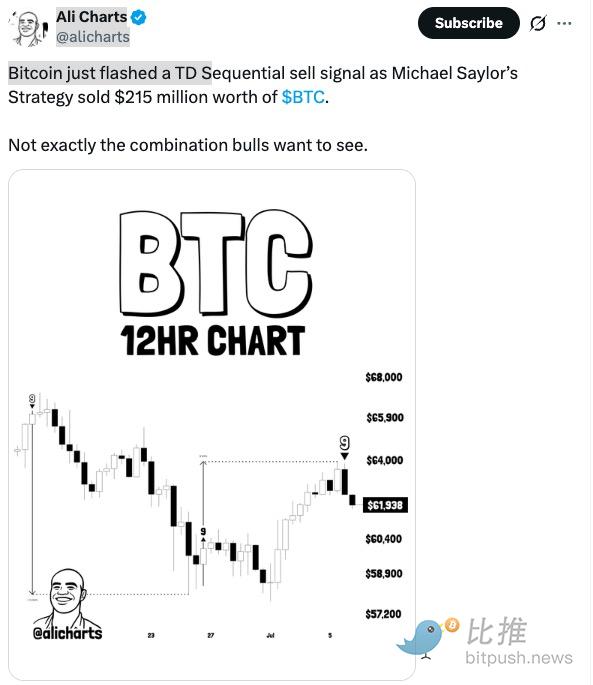
Well-known analyst Ali pointed out on X that the timing of this sale was “not very friendly to bulls” — the TD Sequential indicator flashed a sell signal at just the same time. The combination of technical signals and institutional sell-offs has indeed put pressure on market sentiment. Martinez described this combination as “not a situation the bulls wanted to see.”
But short term noise aside, there are a few key stats worth keeping in mind:
First, the ratio is extremely small. As of July 5, Strategy still holds 843,775 BTC, plus $2.55 billion in cash. 3,588 BTC accounts for only about 0.4% of the total holdings.
Second, the purpose is clear. Saylor confirmed on X that this sale, which is dedicated to paying dividends on digital credit securities, is a capital structure management rather than a strategic shift.
Third, the net buyer status has not changed. Strategy bought 85,296 BTC in the second quarter, and sold only 3,620 during the same period, with a buy/sell ratio as high as 22. 5:1.
Technical side: mainly volatile
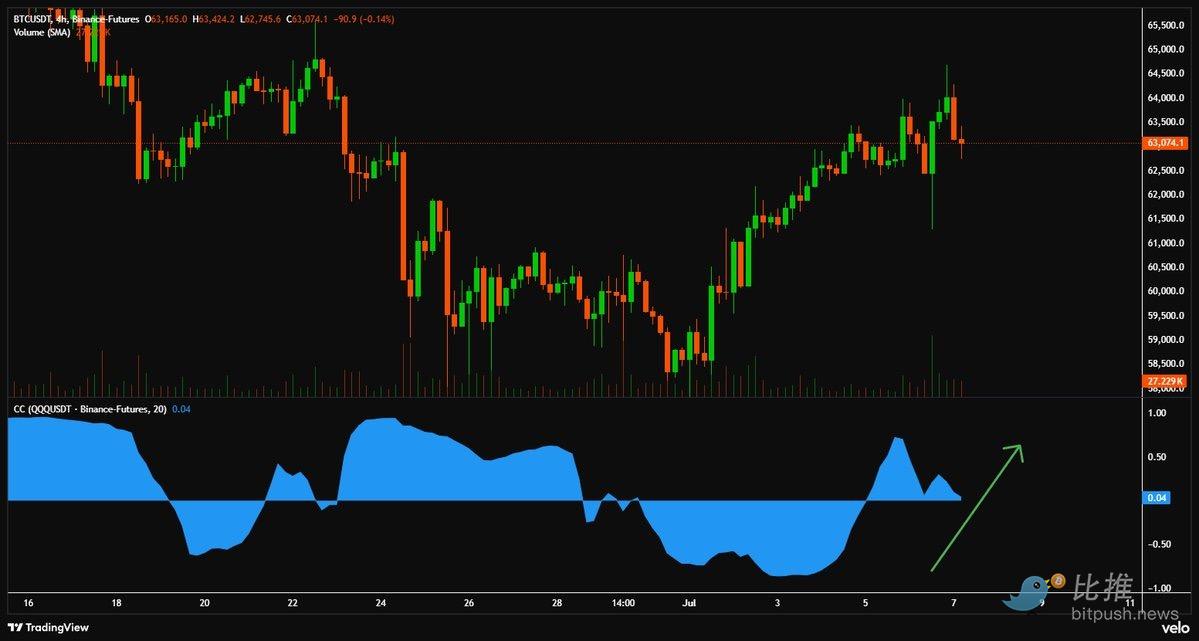
Well-known trader Daan Crypto Trades posted a chart on X showing the correlation between Bitcoin and Nasdaq, which went from -0.87 to +0.72 in just a few days.
What does that mean? -0.87 means that the two fluctuate almost in reverse: US stocks rise and Bitcoin fall, US stocks fall and Bitcoin rise, like hedging tools. +0.72 means that the two fluctuate in the same direction: when US stocks rise, Bitcoin rises, and when US stocks fall, Bitcoin also falls, like a technology stock.
But strangely enough, this correlation is now back in the middle. So you can see this kind of split market: the NASDAQ fell by more than 1%, and although Bitcoin also fell back, the decline was far less than that of technology stocks, and remained stable above 63,000. It has neither completely followed the decline, nor has it come out of a completely independent market — this is the middle state. How to choose the direction for the next few days is critical.
Daan also mentioned one point: Bitcoin has not actually been fixed for most of the time since 2025, but 2026 has proven one thing — Bitcoin can indeed follow its own path for several months without following US stocks.
Back to the tech side. Currently, the most important line of defense is in the $62,700 to $62,900 range, which combines the 200-week moving average with other key technical levels. If held, the next target for the bulls is the $69,000 macro resistance level; failure to hold on may accelerate the decline towards $58,500.
Also, Bitcoin's 30-day implied volatility has just jumped to 40%, ending six consecutive days of decline. This shows that the market has no idea about the short-term direction; everyone is waiting for a clear direction.
So what do you think of it next? The core variable is still an ETF.
If ETF funds continue to flow back, Bitcoin will have the ambition to challenge $69,000; if the inflow of these two days is only short-lived, then this round of rebound is likely to be a dead end.
Author: Bootly
Twitter:https://twitter.com/BitpushNewsCN
Compare the TG exchange group:https://t.me/BitPushCommunity
Compare TG subscriptions:https://t.me/bitpush
