


In-depth research report: Fintech relies on a draw to win, while DeFi's turnover is trillions but only makes a fraction

Source: Artemis &Fintech Architects
Original title: Report: Is Fintech or DeFi a better financial system?
Compiled and organized by: bitPushNews
Foreword:
Fintech Architects and Artemis, a digital finance think tank, jointly released the first comparative analysis report on key performance indicators (KPIs) of fintech (Fintech) and decentralized finance (DeFi). If you've ever struggled with Robinhood or Uniswap who is a better asset to invest in, then you've come to the right place.
For the first time, this report compares fintech stocks and crypto tokens in the same dimension. Covering fields such as payments, digital banking, transactions, lending and forecasting markets, the report compares revenue, number of users, take rates (take rates), industry KPIs, and valuation metrics. The results were shocking:
HYPERLIQUIDThe trading volume has reachedRobinhood50% or more;
DeFiprotocolsAaveThe total amount of outstanding loans exceeds that of Buy-To-Pay later giant Klarna;
The growth rate of stablecoin settlement networks far exceeds that of traditional payment providers;
Phantom 和 MetaMaskWait until the wallet's user size is sufficient andNubank、RevolutComparable to other digital banking giants.
We found that valuations fully reflect this game: crypto assets are either at a very high premium or at a deep discount, depending on their expected ability to cash out. Ultimately, we think the core question of merging the two is: will the crypto industry learn to establish a “toll booth”, or will the fintech industry switch to the crypto industry's “open track”?
A game between two financial systems
For years, we've seen cryptocurrency and fintech as parallel universes. One is a system that is regulated, audited, and traded on NASDAQ; the other is a system for trading on decentralized and centralized exchanges without permission. They share a common language: revenue, volume, payments, borrowing, trading, but with different “accents.”
This situation is changing. Along withstripeBridge acquisition, Robinhood launch prediction market,PayPalMint your own stablecoin, and the boundaries begin to blur. The question is, when these two worlds collide, what is the power comparison?
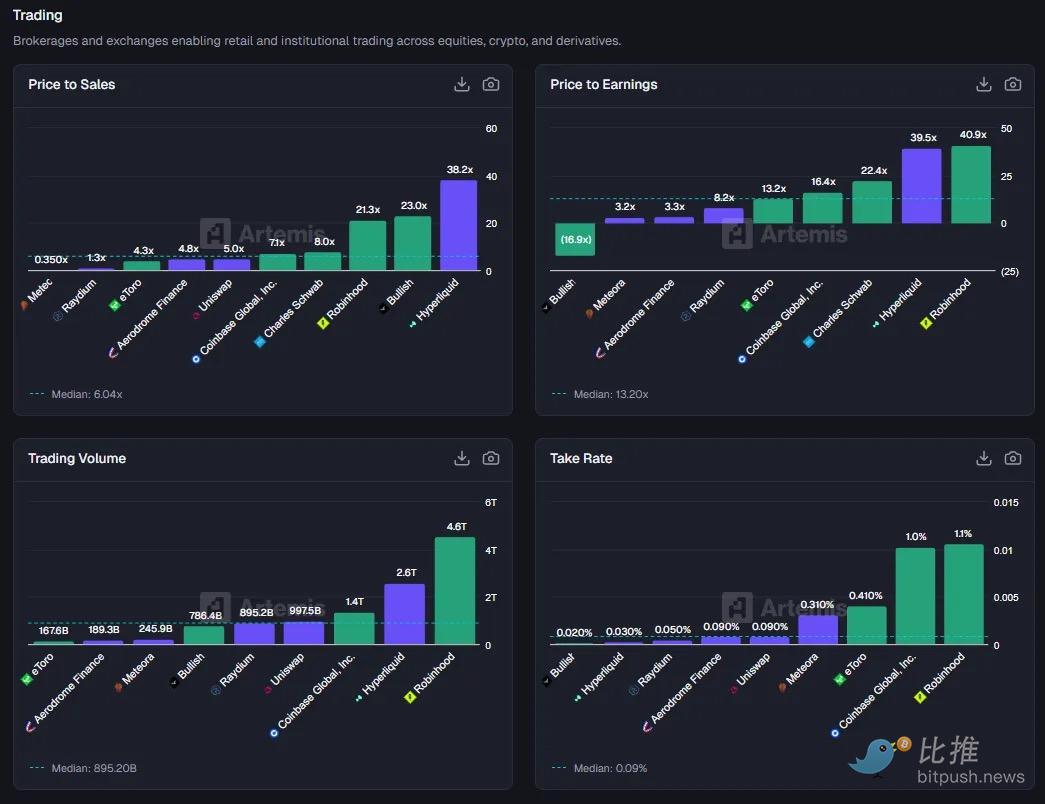
Comparison chart description: In our chart, purple represents cryptocurrencies (Crypto) and green represents equity companies (Equities). Currently, Robinhood is number one in trading volume, but Hyperliquid is in second place right after...
We decided to conduct this experiment: select well-known fintech companies in the fields of payments, digital banking, buy now, pay later (BNPL), and retail brokers, and stack them against crypto-native benchmarking protocols. We used the same metrics (P/S market rate, ARPU per capita revenue, total TPV payments, number of users, etc.). The green bar chart represents US stocks, and the purple bar chart represents the token agreement.
A panoramic picture of these two financial systems has emerged: on-chain financial agreements often match or surpass fintech rivals in terms of transaction volume and asset size, yet they capture only a fraction of the economic benefits of each other. In contrast, the valuation of crypto assets is either extremely high or extremely low, and there is little middle ground. Moreover, the two are not growing at the same rate at all.
The field of payments: a channel for the flow of funds
Start with the biggest category of fintech — money transfers.
Green camp (lots of giants):
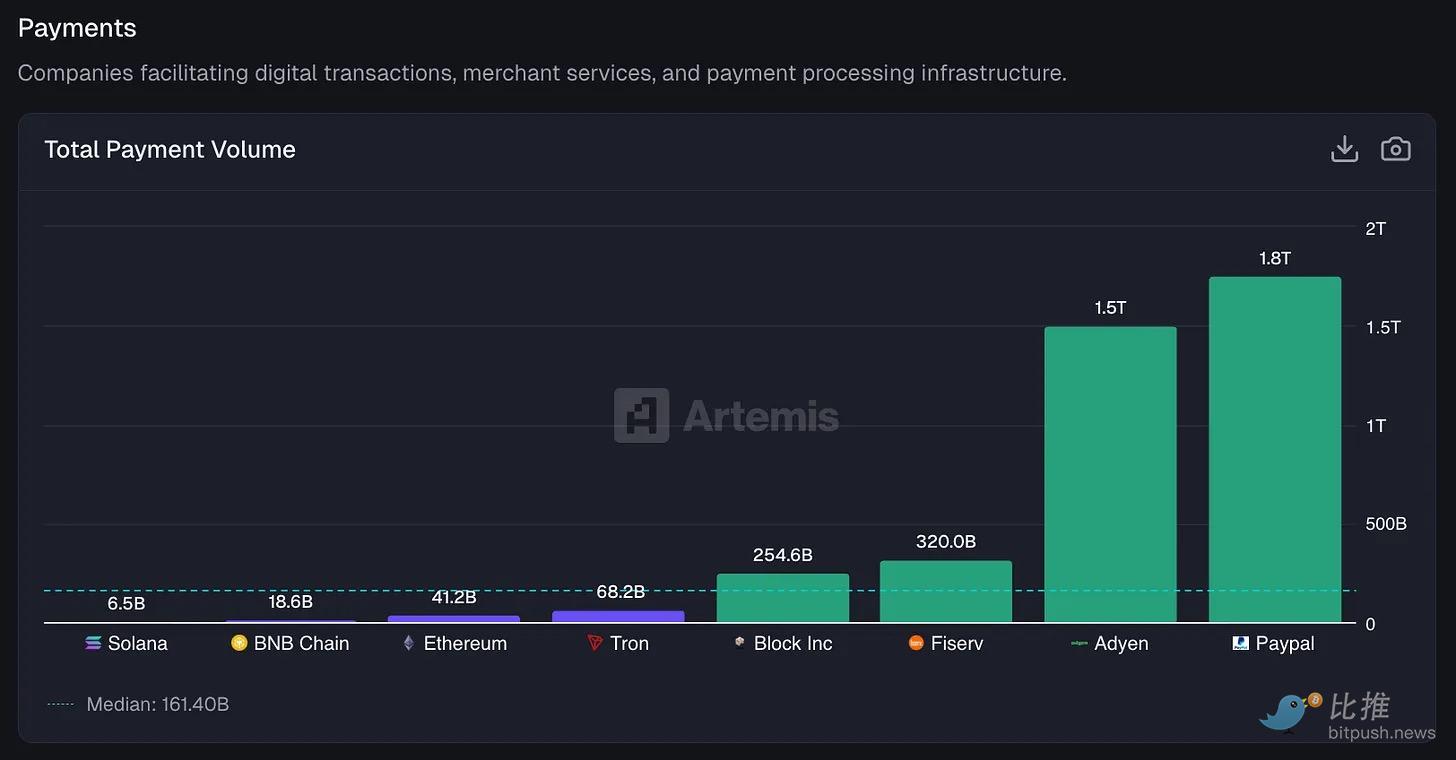
PayPal's annual transaction volume is $1.76 trillion.
Adyen's processing volume amounts to $1.5 trillion.
Fiserv (that almost forgotten infrastructure layer) processed $320 billion.
Block(Formerly Square) viaCash Appand merchant networks drove $255 billion.
Purple Camp (Annualized B2B Payments Estimated by Artemis):
Tron has moved $68 billion in stablecoins.
Ethereum reached $41.2 billion.
BNB was $18.6 billion.
Solana is around $6.5 billion.
Judging from absolute numbers, the two are not on the same scale. The amount of stablecoin transfers across all major public chains is only about 2% of traditional fintech payment processors. On the market share chart, the purple bars are almost negligible.
But what's interesting is the growth rate:
Last year, PayPal's total payments grew by only 6%, Block grew 8%, and European darling Adyen achieved 43% growth (which is already very strong by fintech standards).
Let's look at blockchain: Tron grew 493%, Ethereum grew 652%, BNB grew 648%, and Solana was the fastest, reaching 755% year-on-year growth. It should be emphasized that this is the B2B payment volume estimated by the Artemis data team based on McKinsey's research.
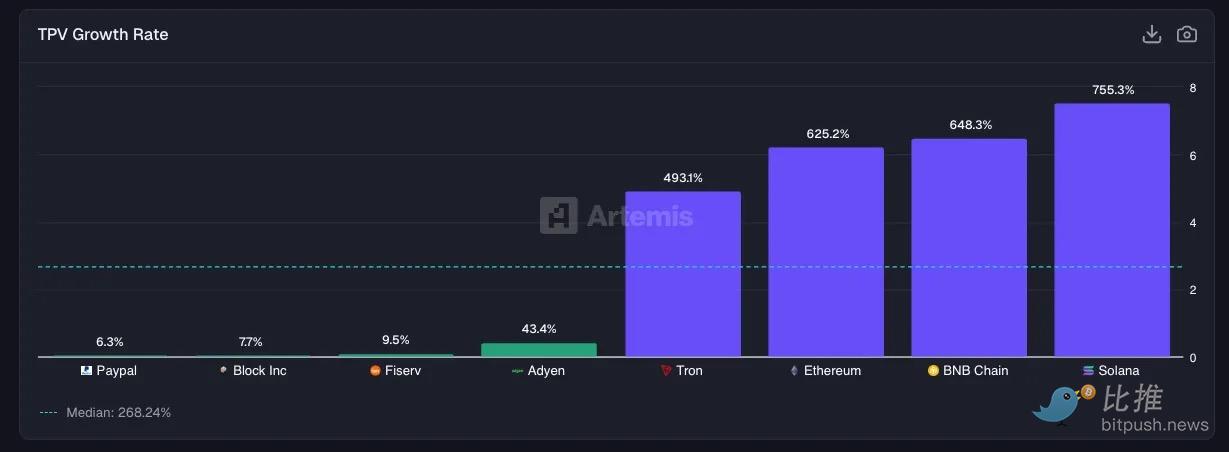 Conclusion: The growth rate of the stablecoin trackFar superiorTraditional payment methods, although they have a much smaller starting point.
Who makes more money next? Fiserv takes 3.16% from every transaction, Block takes 2.62%, and PayPal 1.68%. Even Adyen, which runs a low-profit business model, has a commission of 15 basis points.
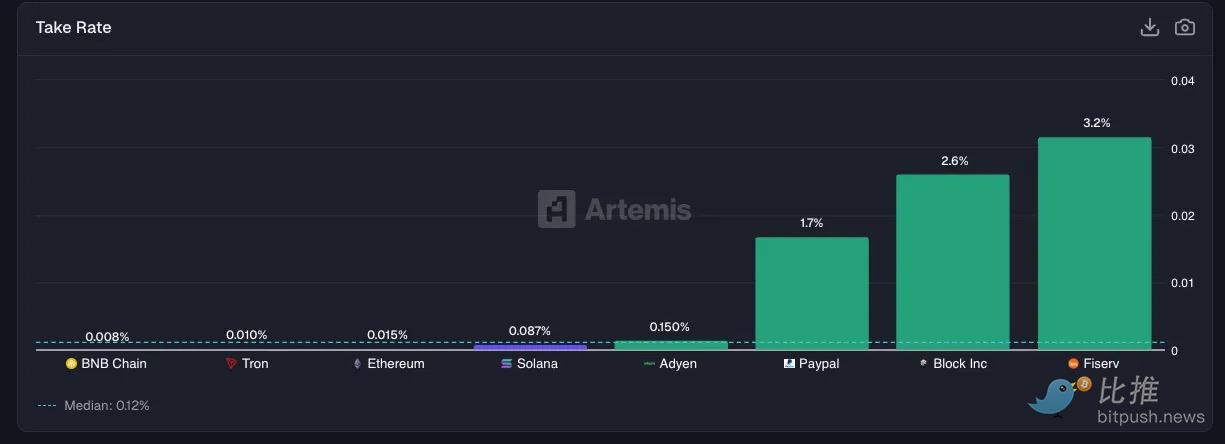 As for blockchains, they have extremely low take rates (take rates) on stablecoins and asset transfers, between 1 and 9 basis points. Blockchain operates by charging gas fees, and by avoiding interchange fees (Interchange Fees) and merchant fees, it has achieved a huge efficiency advantage over traditional channels. Although this limits the revenue of the underlying protocol, it creates profit margins for upper-tier payment orchestrators with additional fees.
Digital banking: wallets become a new type of bank account
On the fintech side, we have real licensed banks: Revolut, Nubank, SoFi, Chime, Wise.
On the crypto side, we're looking at wallets and revenue protocols: MetaMask, Phantom, Ethena, EtherFi. Although they don't have a “bank,” tens of millions of people store their assets and earn interest on them.
User comparison:
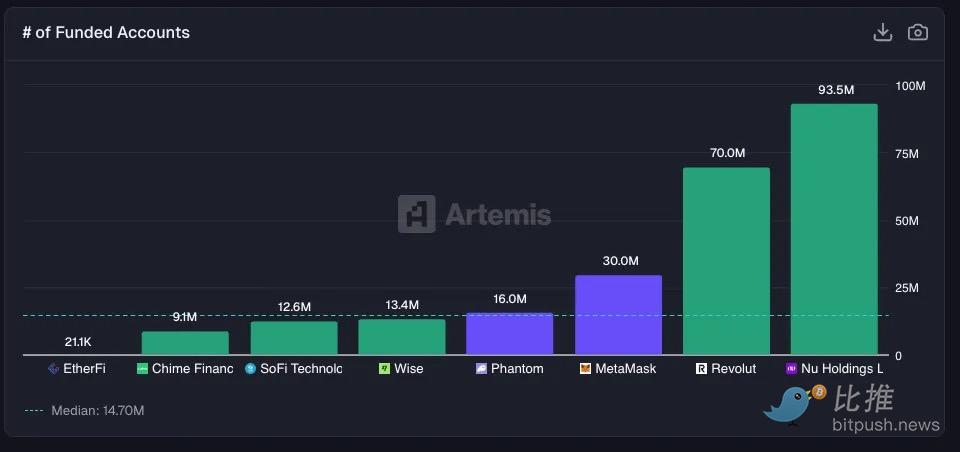
With 93.5 million monthly active users (MAU), Nubank is the world's largest digital bank.
Revolut has 70 million users.
MetaMask followed with 30 million months of activity, surpassing Wise, SoFi, and Chime.
Phantom has 16 million monthly lives and has expanded to multiple chains, and even launched its own debit card and tokenized shares.
Deposit size (deposit of funds):
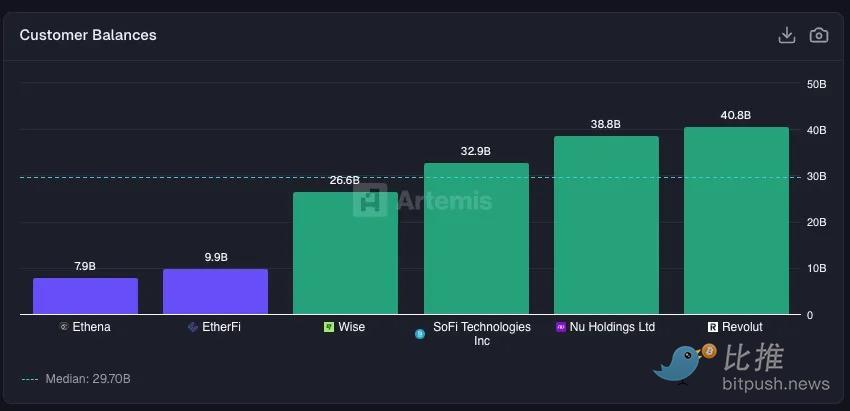
Revolut holds $40.8 billion in customer balances.
Nubank is $38.8 billion.
SoFi is $32.9 billion.
In the crypto sector, EtherFi (liquidity restaking) holds $99 billion and Ethena (synthetic dollars) holds $79 billion. Although this is known in the industry as TVL (Total Locked Value), from a user's perspective, it's money stored somewhere to earn revenue.
Profitability gap:
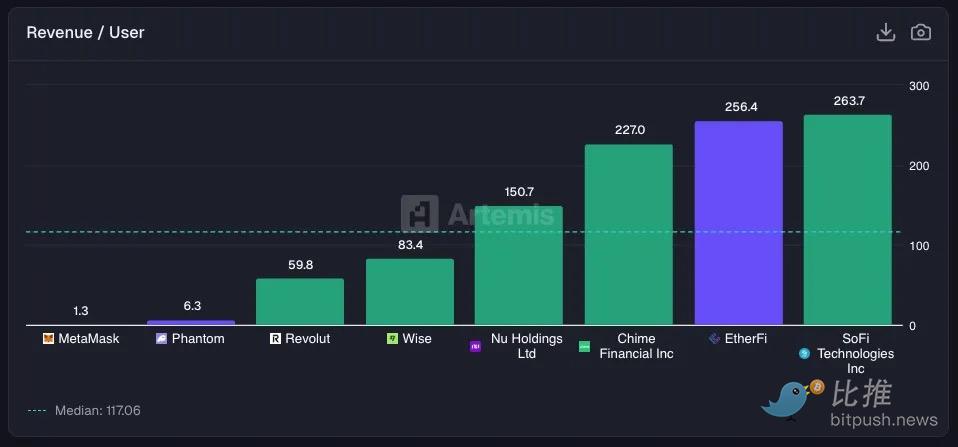
SoFi's per capita annual revenue (ARPU) is $264 because it cross-sells across all aspects through loans, investments, and credit cards.
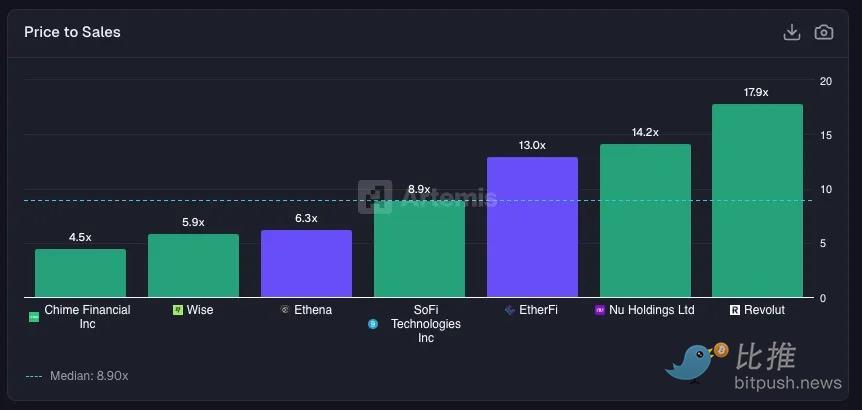
EtherFi's per capita revenue is also as high as $256, which is comparable to SoFi. But embarrassing: EtherFi only has 20,000 active users, while SoFi has 12.6 million. This means that DeFi protocols can extract value from niche users as efficiently as top digital banks, but have yet to reach the public.
In comparison, MetaMask earned around $85 million last year, and ARPU was just $3.
Valuation logic:
The market's valuation of the two was surprisingly consistent. Revolut's market-sales ratio is 18x, while EtherFi is 13x and Ethena is 6.3x. The current trend of integration is “wallet banking”: MetaMask adds debit cards, Phantom integrates fiat channels.
Trading field: On-chain DEXs challenge traditional brokers
In the capital market, the size of on-chain exchanges is astonishing.
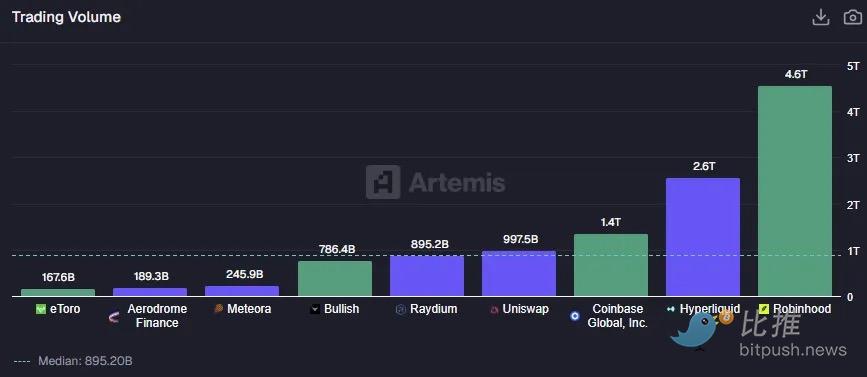
Robinhood has processed $4.6 trillion in transactions over the past 12 months.
Hyperliquid (decentralized perpetual contracts) processed around $2.6 trillion.
Coinbase processed $1.4 trillion.
The aggregated trading volume of mainstream DEXs such as Uniswap and Raydium is on par with Coinbase. This was unimaginable three years ago.
However, the “DEX paradox” lies in the yield rate:
Robinhood's combined yield is 1.06% and Coinbase's 1.03%.
The DEX camp's draw rate is between 3 and 9 basis points.
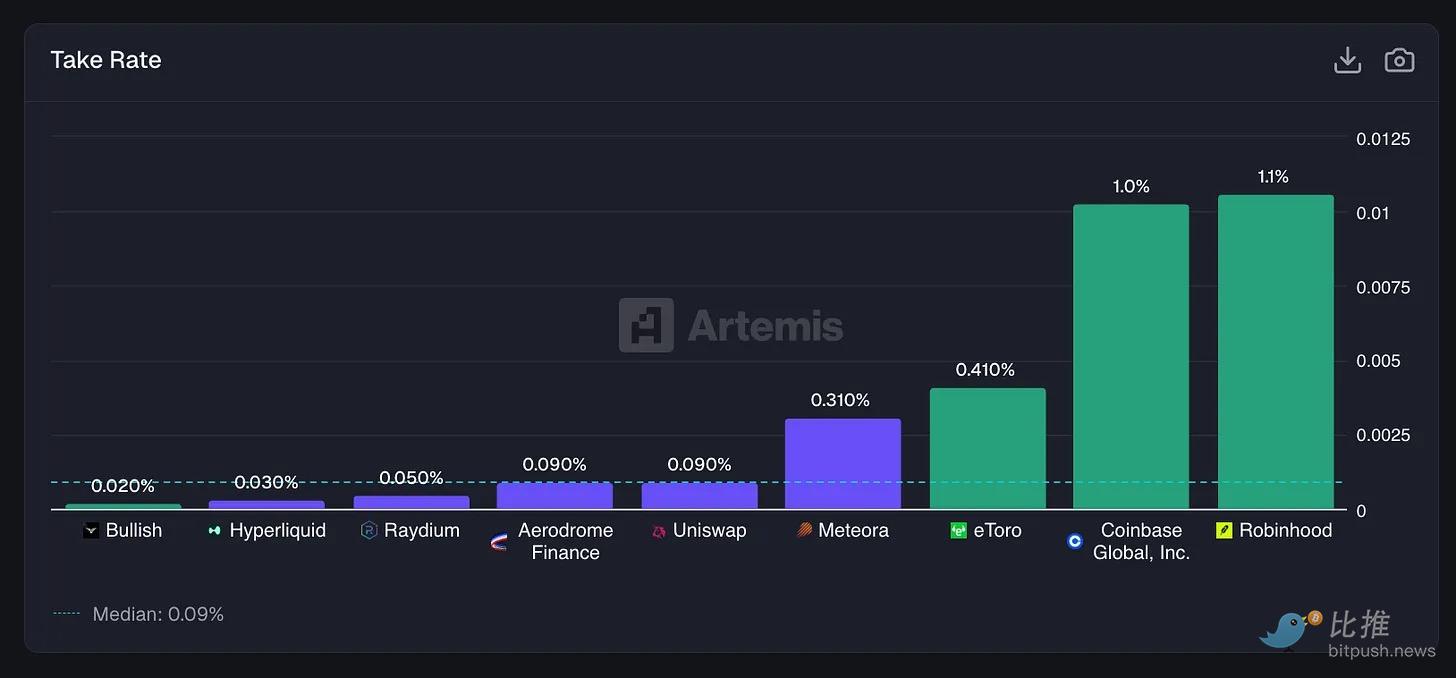
Yield = LTM revenue/trading volume. eToro, Coinbase, Robinhood, Bullish's revenue comes from earnings reports. Raydium, Aerodrome, Uniswap, Meteora from Artemis。
This means that Uniswap only generates around $29 million in protocol revenue with a trading volume of $1 trillion; while Coinbase can generate $14 billion in revenue with a trading volume of $1.4 trillion.
In terms of market valuations, the results are consistent with these issues.
Coinbase trades at 7.1 times sales
Robinhood is trading at 21.3x, which is high for brokers but is supported by growth
Schwab is 8.0 times, a mature multiple of a mature business
Uniswap trades at 5.0 times fees (fees)
Aerodrome is 4.8 times more expensive
Raydium is 1.3 times the cost
The market doesn't value these agreements the same way high-growth tech companies do, partly because they generate lower commission rates compared to traditional brokerage firms.
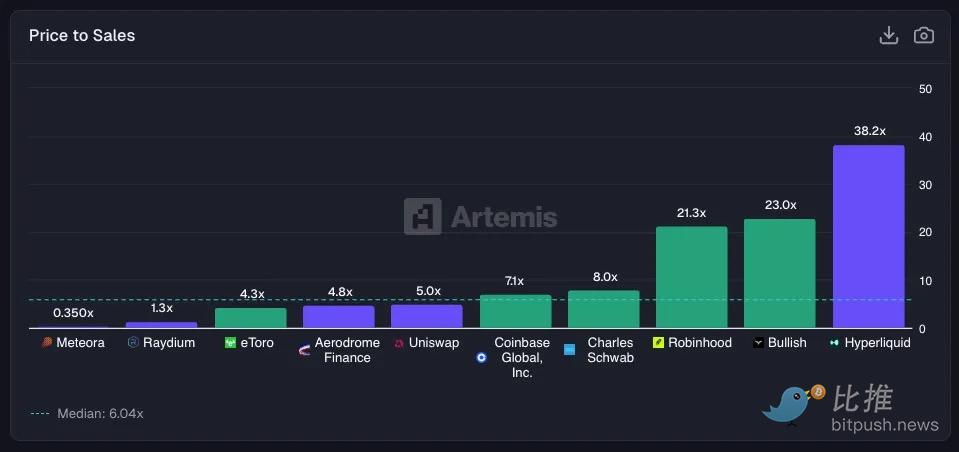
Market Capitalization/LTM Revenue. The publicly reported market capitalization for the stock comes from Yahoo Finance, and the token comes from Artemis.
The stock price performance chart shows the trend of sentiment.
Since the end of 2024, Robinhood has risen approximately 5.7 times, riding the fast train of retail investment and cryptocurrency recovery. Coinbase is up 20% over the same period. Uniswap is down 40%. Despite significant trading volume flowing to their DEXs, the tokens haven't captured that much value, in part because their use as an investment tool isn't clear enough. The only exception is Hyperliquid, which has increased almost as much as Robinhood over the same period due to its huge rise.
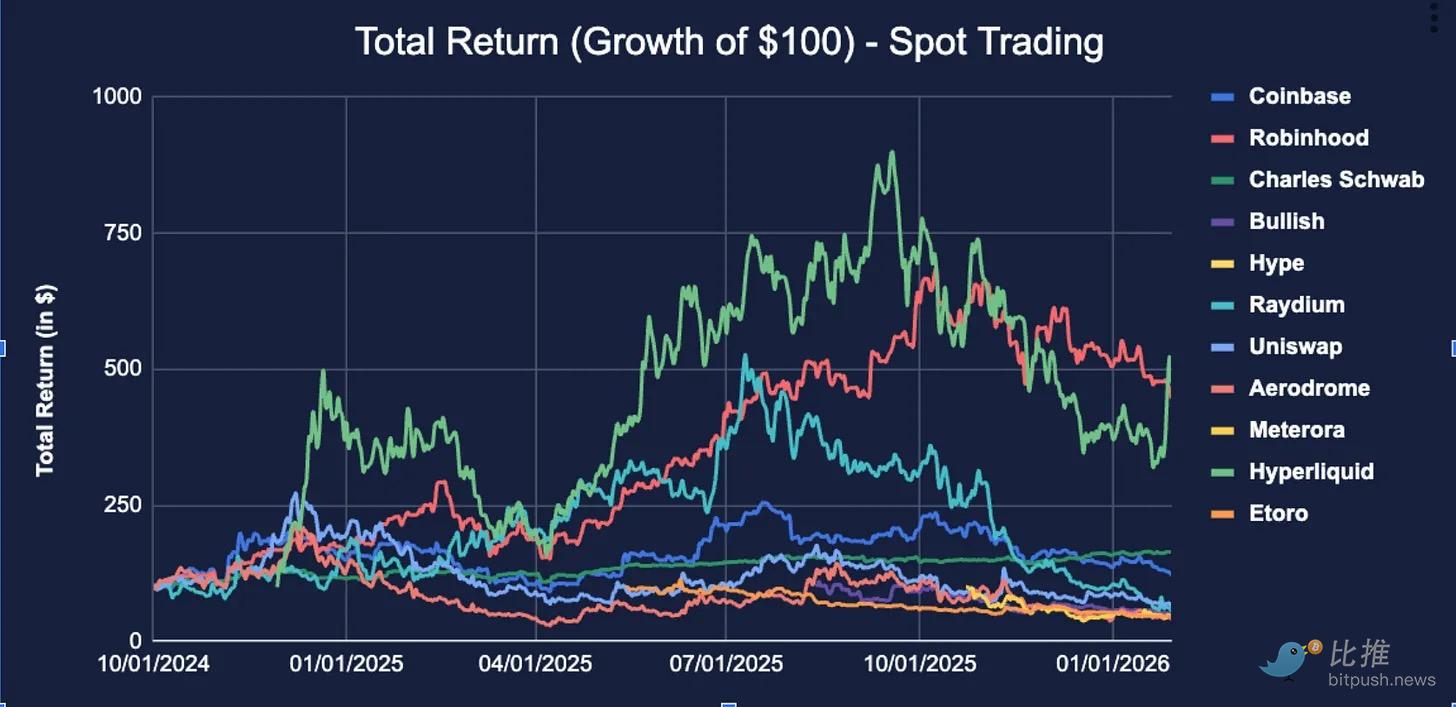 Although DEXs have historically failed to capture value and are viewed as public goods, projects like Uniswap are turning on their “fee switch,” and fees are being used to destroy UNI tokens, which now generate $32 million in annualized revenue.
We hope that as more transaction volume is transferred to the chain, value can flow back to DEX tokens, and Hyperliquid is a great example of success. Currently, however, DEX tokens will perform less well than their CEX stock rivals until token holder value capture mechanisms such as Hyperliquid are introduced.
Borrowing: Underwriting the Next Generation
Borrowing is where the contrast becomes even more interesting. On this side, you have Fintech's core borrowing product: unsecured consumer credit.
Affirm lets you pay for your Peloton bike in four installments
Klarna does the same thing with fast fashion products
Lending Club pioneered peer-to-peer (P2P) loans before becoming a real bank.
Funding Circle underwrites small and micro enterprise loans.
These companies make money by charging borrowers higher than interest paid to depositors, and hope that default won't eat up interest spreads.
On the other side, you have secured DeFi borrowing. Aave, Morpho, Euler. Borrowers deposit ETH, lend USDC, and pay interest rates determined by an algorithm. If the collateral falls too much, the agreement will automatically sell it. There were no collection calls or write-offs.
These are businesses with the same name but completely different in nature.
Start with the loan ledger. Aave has $22.6 billion in outstanding loans. That's more than Klarna ($10.1 billion), Affirm ($7.2 billion), Funding Circle ($2.8 billion), and Lending Club ($2.6 billion) combined. The biggest DeFi lending protocol has a larger loan ledger than the biggest BNPL players. Let this fact settle in.
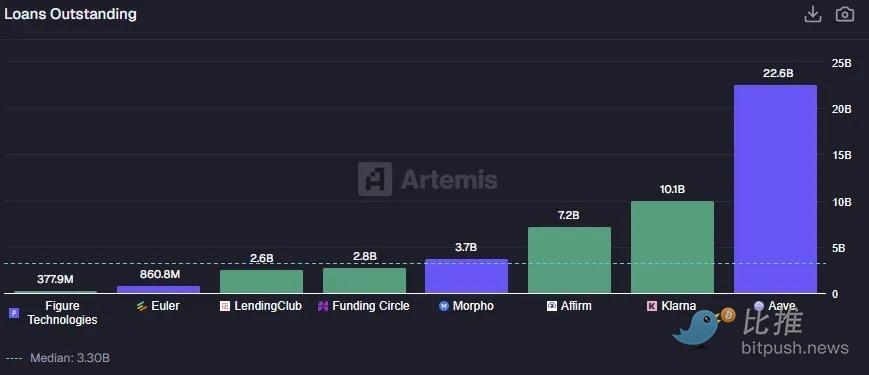
Total loan amounts from Lending Club, Funding Circle, Affirm, Klarna, and Figure come from financial reports. Euler, Morpho, Aave's loan deposits came from Artemis.
Morpho added another $3.7 billion. Euler relaunched after the theft in 2023 and has $861 million. The total size of the DeFi lending stack is enough to rival the entire listed digital lending sector in about four years. But the economic model is reversed.
Funding Circle's “net interest spread” (NIM) is 9.35% (due to its business model similar to private equity credit). Lending Club is 6.18%. Affirm received 5.25% despite being a BNPL company rather than a traditional lender. These are generous spreads and are compensation for credit risk absorbed by these companies through actual execution of underwriting.
On the cryptocurrency side, Aave's net interest spread is just 0.98%. Morpho is 1.51%. Euler is 1.30%. Despite having larger loan ledgers, DeFi protocols generally yield less than those of fintech lenders.
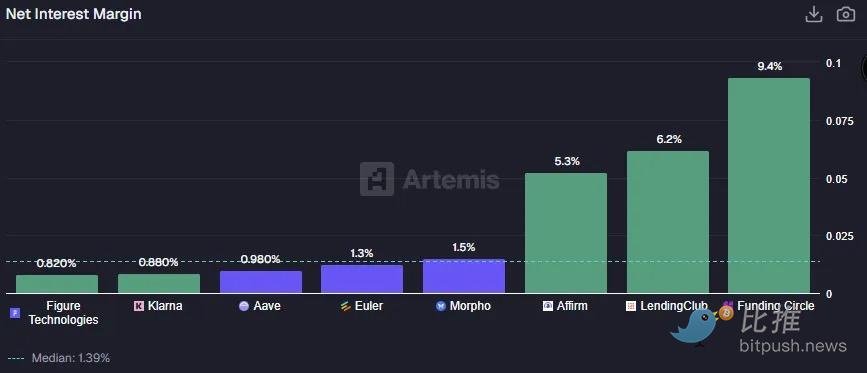
Aave, Euler, Morpho's net interest spread = revenue/loan deposit. The net interest spread on stocks comes from earnings reports.
DeFi lending is overcollateralized by design. To lend $100 at Aave, you usually deposit $150 or more in collateral. The agreement bears no credit risk. It bears the risk of liquidation, and borrowers are paying for leverage and liquidity rather than the privilege of receiving credit privileges they would otherwise be unable to obtain.
Fintech lenders are doing the opposite. They provide unsecured credit to consumers who want to buy now and pay later. The spread compensates those who never pay back their money. This is reflected in the actual number of losses due to default, and managing these losses is the core job of underwriting.
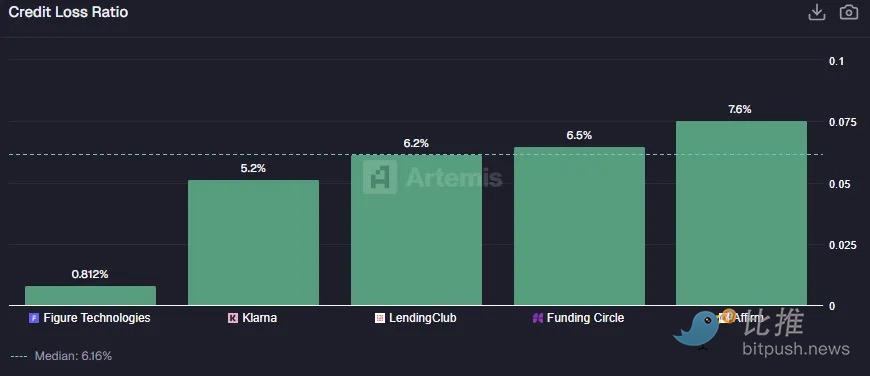
The stock's credit loss ratio (Credit Loss Ratio) comes from public financial reports.
So which model is better? It depends on what you're optimizing.
Fintech lending serves borrowers who need money they don't have right now, and bears real underwriting risk. It's also cruel. Early digital lenders (OnDeck, Lending Club, Prosper) were on the verge of going out of business several times. Although the business is actually running well, Affirm's stock price is still down about 60% from its high point, usually because underwriting revenue is priced at SaaS multiples without fully accounting for unavoidable late-stage losses.
DeFi lending is a leveraged business. It serves people who already own assets but want liquidity and don't want to sell them, similar to margin accounts. Other than the quality of the collateral, there are no credit decisions here. It is capital efficient, scalable, and earns meager profits on huge trading volumes. It's also only useful for those who already own a large amount of assets on the chain, want to earn profits, or want extra leverage.
Predicting the Market: Who Knows?
Finally, let's take a look at the prediction market.
These projects are the newest and most peculiar battleground between Fintech (Fintech) and decentralized finance (DeFi).
For decades, they were just an academic anecdote, loved by economists but hated by regulators. Iowa Electronic Markets (Iowa Electronic Markets) has run small-scale election predictions. After a brief boom, Intrade was shut down. Most of these projects are labeled “gambling” or “sports betting.”
The idea that you can trade real-world results and that these markets can produce more accurate predictions than polls or leading experts was largely a theory in the past.
That all changed in 2024 and further accelerated during the second Trump administration. Polymarket processed over $1 billion in election bets. Kalshi won a lawsuit against the US Commodity Futures Trading Commission (CFTC) and introduced political contracts to US users. Robinhood, which has never let go of any trends, has also added event contracts. DraftKings, a giant that already runs a factual prediction market through Daily Fantasy Sports (Daily Fantasy Sports), has made a silent fortune with a market capitalization of 15.7 billion US dollars and revenue of 5.5 billion US dollars.
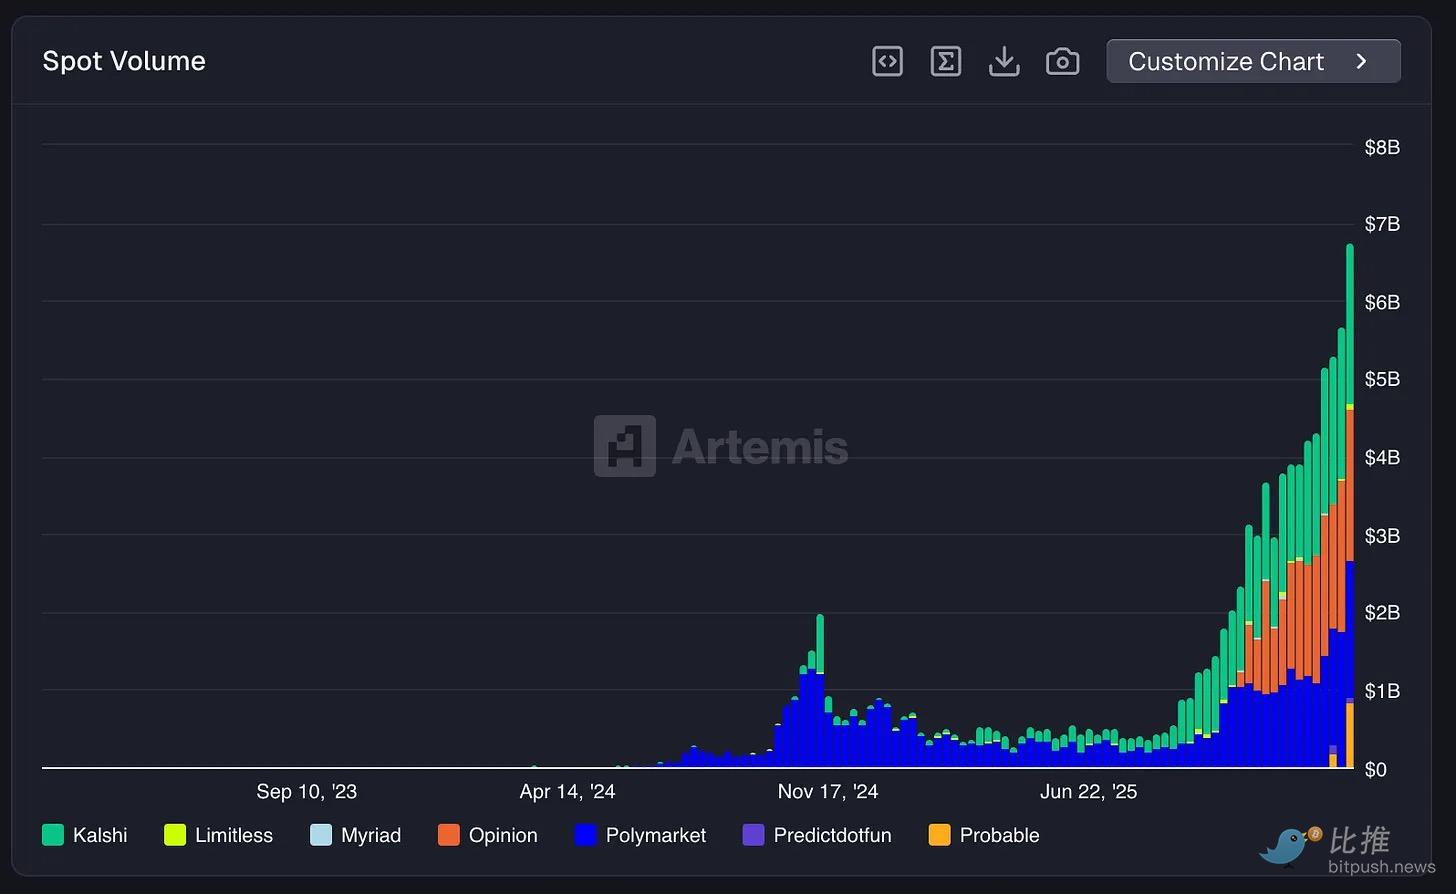
Artemis Predictive Market Dashboard
(Chart description: Kalshi and Polymarket's spot trading volume data comes from Artemis. (For DraftKings, the transaction volume uses the “Sportsbook Handle (Sportsbook Handle),” which is the total amount of settled customer bets on its sports betting products.)
The category moved from the segment market to the mainstream in about 18 months, predicting that the weekly trading volume of the market reached around $7 billion, once again reaching a record high.
Over the past 12 months, DraftKings has processed $51.7 billion in transaction volume. Polymarket handled $24.6 billion, about half of the former, despite being a cryptography-native protocol and not technically accessible to US users. The regulated US alternative Kalshi handled $9.1 billion. In terms of trading volume alone, Polymarket is extremely competitive. While Kalshi was still arguing in court, it had already built a liquid global prediction market on Polygon.
But if you look at revenue, this comparison is untenable.
DraftKings generated $54.6 billion in revenue last year, while Kalshi only boosted $264 million. After Polymarket launched taker fees (taker fees) for the “15-minute cryptocurrency market,” its annualized revenue run rate (annualized revenue run rate) was only 38 million US dollars.
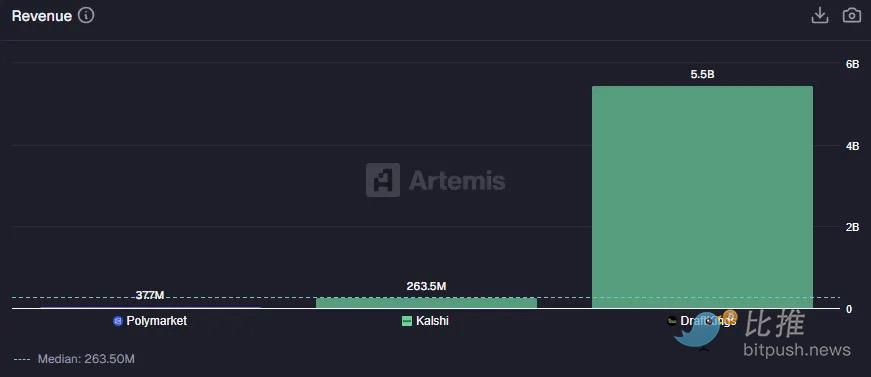
Forecast market revenue comparison(Chart description: Polymarket revenue data is from Artemis, Kalshi's revenue data is from the citation link, and DraftKings revenue data for the past 12 months (LTM) is from financial disclosure.)
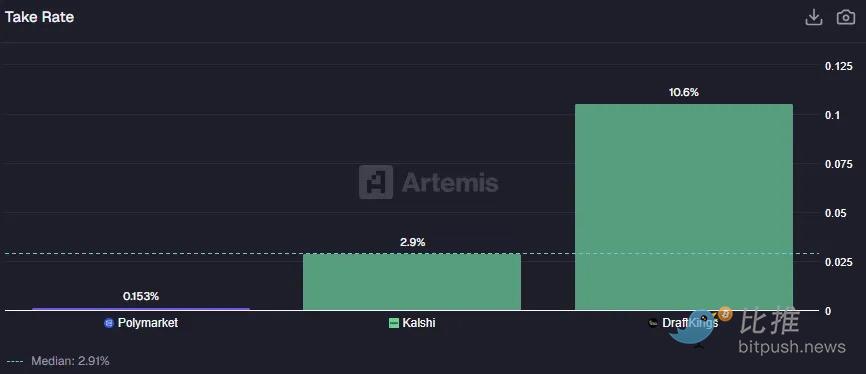
The huge gap lies in the Take Rates (Take Rates), or “Hold (Hold)” in sports betting jargon.
DraftKings kept 10.57% of every $1 bet. This is a typical sports betting model: the bookmaker draws shares, provides odds, and manages risk.
Kalshi draws 2.91%, which is a thinner profit more suitable for financial exchanges.
Crypto-native Polymarket draws only 0.15%. Out of $24.6 billion in trading volume, it is currently capturing very little value.
Yield = Revenue/Trading Volume for the past 12 months
This is yet another repetition of the decentralized exchange (DEX) dynamic. Polymarket's focus is not on value capture, but on providing the infrastructure to predict the existence of a market, match buyers and sellers, and settle contracts on-chain. It doesn't hire odds makers, doesn't manage balance sheets, and doesn't act as your counterparty. While the efficiency is amazing, monetization isn't its core focus.
Investors, however, clearly believe Polymarket will eventually be able to monetize:
Polymarket is valued at $9 billion and has a price-to-sales ratio (P/S) of 240 times.
Kalshi was valued at $11 billion, corresponding to $264 million in revenue, and the transaction multiplier was 42 times.
DraftKings has a trading multiplier of just 2.9x.
Venture capital (VC) simply couldn't stop “throwing money” at these platforms, while “traditional” operators like DraftKings and Flutter (FanDuel) watched their share prices plummet.
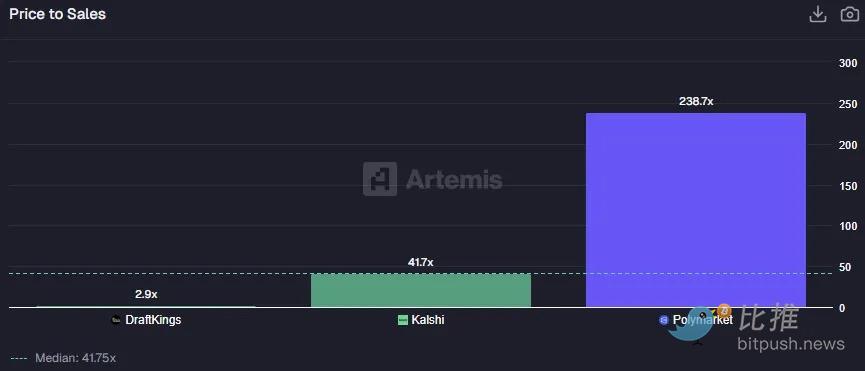
Forecast market value comparison
(Chart note: The market capitalization of Kalshi and Polymarket uses the latest private equity valuations. DraftKings market capitalization comes from Yahoo Finance.)
Polymarket's valuation logic assumes that it will either start to monetize in an ambitious way or evolve into something much larger than the predicted market size. At a market rate of over 200 times, you're not buying a company, but a call option for a new financial primitive. Maybe Polymarket will become the default place to hedge against any real-world events. Maybe it'll add more sports, earnings, weather, or anything with binary results. Perhaps it will capture a larger percentage instead of 0.15%, suddenly generating multi-billion dollar gains.
This is the purest form of the “convergence” question: is the future a regulated exchange with a commission rate and compliance department, or a license-free agreement that allows anyone, anywhere, to bet on anything without leaving any profit to the bookmaker?
The final fusion
A few years ago, we couldn't compare DeFi and Fintech together. But now, the data is in front of us.
Cryptocurrency has built a financial infrastructure that is comparable to fintech in terms of transaction volume, number of users, and scale of assets. The stablecoin track is more global than traditional payments, Aave's ledger is larger than Klarna's, and Polymarket is devouring a share of the gaming market. The technology has worked, and the product has found an audience.
But here's a key “catch”: the crypto industry is in terms of economic value capture (exchange rate)Far less thanTraditional financial technology.
You can think of it as a “feature” (Feature): it represents the ultimate democratization and efficiency of financial services, benefiting users by destroying profit margins. You can also think of it as a “bug” (Bug): if the agreement doesn't generate enough revenue, the sustainability of its token value will be challenged.
Fusion is taking place. Banks are piloting tokenized deposits, the NYSE is studying tokenized stocks, and the total market value of stablecoins has exceeded 300 billion US dollars. Fintech giants see where the future is going — they won't sit back and wait; they will choose to absorb and assimilate it.
The question for the next decade is simple: will the crypto world learn to build toll booths, or will traditional finance learn to take the path of the crypto world? We betBoth will happen.
Twitter:https://twitter.com/BitpushNewsCN
Compare the TG exchange group:https://t.me/BitPushCommunity
Compare TG subscriptions:https://t.me/bitpush
